Adjusting for extraneous factors
240 likes | 356 Views
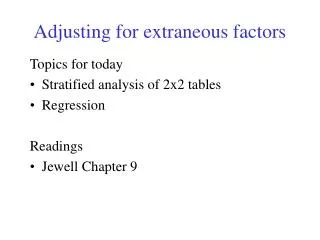
Adjusting for extraneous factors. Topics for today Stratified analysis of 2x2 tables Regression Readings Jewell Chapter 9. Berkeley Admissions Data.

Adjusting for extraneous factors
E N D
Presentation Transcript
Adjusting for extraneous factors Topics for today • Stratified analysis of 2x2 tables • Regression Readings • Jewell Chapter 9
Berkeley Admissions Data 1973 study showed that 45% of 2691 male applicants were admitted, compared with only 30% of 1835 female applicants. The odds ratio is 1.84 with 95% confidence interval (1.62, 2.08). Is this evidence of sex bias? Log odds ratio = 95% conf interval:
Berkeley Admissions Data The picture changes completely once we look at admissions by department! Bickel, P.J., J.W. Hammel and J.W. O'Connell (1975) "Sex bias in graduate admissions: Data from Berkeley" in Science, 187:398-403)
Stratified analysis • Consider relationship between a disease outcome (D in Jewell, often Y in practice) and an exposure (E in Jewell, often X in practice), but we also want to adjust for an additional factor such as age or sex that can be divided up into I distinct strata. • Suppose that the data from the ith stratum can be represented as follows: • Jewell Tables 9.2 & 9.3 give two examples
What do we want to do? • Ask whether there is a significant association between disease (D) and exposure (E), after adjusting for the additional stratification factor • Estimate an adjusted odds ratio, that appropriately takes into account the stratification factor. Lets start with 1. but first, we need to quickly go over another way to assess whether there is a significant association for a 2x2 table
Assessing association - Berkeley Admissions again We already determined that there is a significant association in this 2x2 table, based on the 95% confidence interval for the odds ratio. An alternative approach is a chi-squared test There are several variations. But basic idea is to compare observed data to what would be expected if there were no association (see J p 69)
Chi-Squared test for a 2x2 table The test statistic is And its “significance” can be determined by looking up the chi-squared tables with 1 degree of freedom. For the Berkeley data, we get:
Back to the stratified analysis Cochran-Mantel-Haenszel test combines the differences between observed and expected values over all the strata. It focuses only on the “a” element of each 2x2 table
Estimating a common effect • Wolf method (averages the log odds ratios) • Mantel-Haenszel (averages the odds ratios) • Regression-based
Wolf’s average log-odds ratio Can add .5 to cell entries if sample sizes are small
Applying Wolf method to Berkeley data Wolf estimate of LOR is .03, with variance .0068. What is 95% CI? Corresponding OR estimate is
Wolf’s average log-odds ratio Can add .5 to cell entries if sample sizes are small
Applying Wolf method to Berkeley data Wolf estimate of LOR is .03, with variance .0068. What is 95% CI? Corresponding OR estimate is
Applying Wolf method to Berkeley data Wolf estimate of LOR is .03, with variance .0068. What is 95% CI? Corresponding OR estimate is
Regression-based analysis for Berkeley data data berkeley; input stratum male a b ; cards; 1 1 512 313 1 0 89 19 2 1 353 207 2 0 17 8 3 1 120 205 3 0 202 391 4 1 138 279 4 0 131 244 5 1 53 138 5 0 94 299 6 1 22 351 6 0 24 317 run; Code continued data berkeley; set berkeley; n=a+b; Unstratified analysis; procgenmod; model a/n=male/dist=binomial; run;
Results of unstratified analysis Standard 95% Confidence Chi- Parameter DF Estimate Error Limits Square P Intercept 1 -0.8305 0.0508 -0.9300 -0.7310 267.56 <.0001 male 1 0.6104 0.0639 0.4851 0.7356 91.25 <.0001 Scale 0 1.0000 0.0000 1.0000 1.0000 Compare with our initial analysis
procgenmod; class stratum; model a/n=male stratum/dist=binomial; run; Stratified analysis Standard 95% Conf Chi- Parameter DF Estimate Error Limits Square Pr > ChiSq Intercept 1 -2.6246 0.1577 -2.9337 -2.3154 276.88 <.0001 male 1 -0.0999 0.0808 -0.2583 0.0586 1.53 0.2167 stratum 1 1 3.3065 0.1700 2.9733 3.6396 378.38 <.0001 stratum 2 1 3.2631 0.1788 2.9127 3.6135 333.12 <.0001 stratum 3 1 2.0439 0.1679 1.7149 2.3729 148.24 <.0001 stratum 4 1 2.0119 0.1699 1.6788 2.3449 140.18 <.0001 stratum 5 1 1.5672 0.1804 1.2135 1.9208 75.44 <.0001 stratum 6 0 0.0000 0.0000 0.0000 0.0000 . . Scale 0 1.0000 0.0000 1.0000 1.0000
More general modeling We can add additional factors into the logistic regression model so as to obtain an estimate of the log-odds ratio, adjusting for all these additional factors. Example, smoking in the Epilepsy study. Lets look in SAS: procfreq ; table one3*cig2 /chisq; run;
Standard Wald 95% Confidence Chi- Parameter DF Estimate Error Limits Square Pr > ChiSq Intercept 1 -3.1396 0.2229 -3.5765 -2.7028 198.41 <.0001 DRUG 1 1 1.0384 0.2876 0.4748 1.6020 13.04 0.0003 DRUG 2 1 -0.2944 0.6275 -1.5243 0.9355 0.22 0.6390 DRUG 3 0 0.0000 0.0000 0.0000 0.0000 . . Scale 0 1.0000 0.0000 1.0000 1.0000 Standard Wald 95% Confidence Chi- Parameter DF Estimate Error Limits Square Pr > ChiSq Intercept 1 -3.3872 0.2435 -3.8644 -2.9100 193.55 <.0001 DRUG 1 1 1.0712 0.2939 0.4952 1.6472 13.29 0.0003 DRUG 2 1 -0.3596 0.6337 -1.6016 0.8824 0.32 0.5704 DRUG 3 0 0.0000 0.0000 0.0000 0.0000 . . CIG2 1 1.0721 0.3131 0.4585 1.6857 11.73 0.0006 Scale 0 1.0000 0.0000 1.0000 1.0000
Why don’t drug estimates change much?? Hint – look at association between drug and smoking
procfreq ; table one3*cig2 /chisq; run;