Download
1 / 167
1.67k likes | 1.78k Views
Review for Final. Statistics 221. Identifying procedure chart. Part I:.

E N D
Review for Final Statistics 221
Part I: 1 24.36 Sparrowhawk colonies. One of nature’s patterns connects the percent of adult birds in a colony that return from the previous year and the number of new adults that join the colony. Can the percent of returning adult birds be use to predict the number of new adults that join the colony?
Part I: 1 24.36 Sparrowhawk colonies. One of nature’s patterns connects the percent of adult birds in a colony that return from the previous year and the number of new adults that join the colony. Can the percent of returning adult birds be use to predict the number of new adults that join the colony? Is this an experiment or an observational study? Can we conclude causation? • experiment—can conclude causation • experiment—cannot conclude causation • observational study—can conclude causation • observational study—cannot conclude causation
Part I: 1 24.36 Sparrowhawk colonies. One of nature’s patterns connects the percent of adult birds in a colony that return from the previous year and the number of new adults that join the colony. Can the percent of returning adult birds be use to predict the number of new adults that join the colony? Is this an experiment or an observational study? Can we conclude causation? • experiment—can conclude causation • experiment—cannot conclude causation • observational study—can conclude causation • observational study—cannot conclude causation
Part I: 1 24.36 Sparrowhawk colonies. One of nature’s patterns connects the percent of adult birds in a colony that return from the previous year and the number of new adults that join the colony. Can the percent of returning adult birds be use to predict the number of new adults that join the colony? What is the response variable? What type of variable? • percent of returning birds in a colony—categorical • percent of returning birds in a colony—quantitative • number of new adults that join colony—categorical • number of new adults that join colony—quantitative
Part I: 1 24.36 Sparrowhawk colonies. One of nature’s patterns connects the percent of adult birds in a colony that return from the previous year and the number of new adults that join the colony. Can the percent of returning adult birds be use to predict the number of new adults that join the colony? What is the response variable? What type of variable? • percent of returning birds in a colony—categorical • percent of returning birds in a colony—quantitative • number of new adults that join colony—categorical • number of new adults that join colony—quantitative
Part I: 1 24.36 Sparrowhawk colonies. One of nature’s patterns connects the percent of adult birds in a colony that return from the previous year and the number of new adults that join the colony. Can the percent of returning adult birds be use to predict the number of new adults that join the colony? What is the explanatory variable? What type of variable? • percent of returning birds in a colony—categorical • percent of returning birds in a colony—quantitative • number of new adults that join colony—categorical • number of new adults that join colony—quantitative
Part I: 1 24.36 Sparrowhawk colonies. One of nature’s patterns connects the percent of adult birds in a colony that return from the previous year and the number of new adults that join the colony. Can the percent of returning adult birds be use to predict the number of new adults that join the colony? What is the explanatory variable? What type of variable? • percent of returning birds in a colony—categorical • percent of returning birds in a colony—quantitative • number of new adults that join colony—categorical • number of new adults that join colony—quantitative
Part I: 1 24.36 Sparrowhawk colonies. One of nature’s patterns connects the percent of adult birds in a colony that return from the previous year and the number of new adults that join the colony. Can the percent of returning adult birds be use to predict the number of new adults that join the colony? What statistical procedure should be performed to answer the research question? • two-sample mean test • chi-square test • ANOVA • test on slope in regression
Part I: 1 24.36 Sparrowhawk colonies. One of nature’s patterns connects the percent of adult birds in a colony that return from the previous year and the number of new adults that join the colony. Can the percent of returning adult birds be use to predict the number of new adults that join the colony? What statistical procedure should be performed to answer the research question? • two-sample mean test • chi-square test • ANOVA • test on slope in regression
Part I: Regression questions 1 24.36 Sparrowhawk colonies. One of nature’s patterns connects the percent of adult birds in a colony that return from the previous year and the number of new adults that join the colony. Can the percent of returning adult birds be use to predict the number of new adults that join the colony? State the null hypothesis in words for testing whether a linear relationship exists between the two variables “Percent return” and “# of new birds”. • H0: no linear relationship • H0: a linear relationship exists • H0: “# of new birds depends on percent return. • H0: there is an association between # of new birds and percent return.
Part I: Regression questions 1 24.36 Sparrowhawk colonies. One of nature’s patterns connects the percent of adult birds in a colony that return from the previous year and the number of new adults that join the colony. Can the percent of returning adult birds be use to predict the number of new adults that join the colony? State the null hypothesis in words for testing whether a linear relationship exists between the two variables “Percent return” and “# of new birds”. • H0: no linear relationship • H0: a linear relationship exists • H0: “# of new birds depends on percent return. • H0: there is an association between # of new birds and percent return.
Part I: Regression questions 1 24.36 Sparrowhawk colonies. One of nature’s patterns connects the percent of adult birds in a colony that return from the previous year and the number of new adults that join the colony. Can the percent of returning adult birds be use to predict the number of new adults that join the colony? State the null hypothesis in symbols for testing whether a linear relationship exists between the two variables “Percent return” and “# of new birds”. • H0: b = 0 • H0: b = 0 • H0: a = 0 • H0: a = 0
Part I: Regression questions 1 24.36 Sparrowhawk colonies. One of nature’s patterns connects the percent of adult birds in a colony that return from the previous year and the number of new adults that join the colony. Can the percent of returning adult birds be use to predict the number of new adults that join the colony? State the null hypothesis in symbols for testing whether a linear relationship exists between the two variables “Percent return” and “# of new birds”. • H0: b = 0 • H0: b = 0 • H0: a = 0 • H0: a = 0
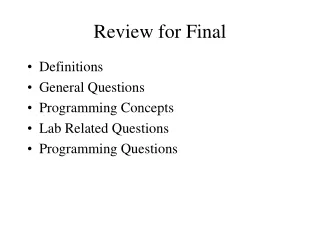
Scatterplot Residual plot Dotplot of residuals
Part I: Regression questions 1 24.36 Sparrowhawk colonies. One of nature’s patterns connects the percent of adult birds in a colony that return from the previous year and the number of new adults that join the colony. Can the percent of returning adult birds be use to predict the number of new adults that join the colony? Is the condition of linear relationship met? Why or why not? • No, because there is a smile or frown pattern in the residual plot. • No, because there are outliers in the residuals. • Yes, because the histogram of the residuals is bell-shaped symmetric. • Yes, because there is no smile or frown pattern in the residual plot.
Part I: Regression questions 1 24.36 Sparrowhawk colonies. One of nature’s patterns connects the percent of adult birds in a colony that return from the previous year and the number of new adults that join the colony. Can the percent of returning adult birds be use to predict the number of new adults that join the colony? Is the condition of linear relationship met? Why or why not? • No, because there is a smile or frown pattern in the residual plot. • No, because there are outliers in the residuals. • Yes, because the histogram of the residuals is bell-shaped symmetric. • Yes, because there is no smile or frown pattern in the residual plot.
Part I: Regression questions 1 24.36 Sparrowhawk colonies. One of nature’s patterns connects the percent of adult birds in a colony that return from the previous year and the number of new adults that join the colony. Can the percent of returning adult birds be use to predict the number of new adults that join the colony? Is it reasonable to assume that the 13 colonies are independent of each other? Why? • No, because birds fly from colony to colony. • No, the # of new adult birds in one colony depends on the # of new adult birds in another colony. • Yes, because the colonies are separate from each other.
Part I: Regression questions 1 24.36 Sparrowhawk colonies. One of nature’s patterns connects the percent of adult birds in a colony that return from the previous year and the number of new adults that join the colony. Can the percent of returning adult birds be use to predict the number of new adults that join the colony? Is it reasonable to assume that the 13 colonies are independent of each other? Why? • No, because birds fly from colony to colony. • No, the # of new adult birds in one colony depends on the # of new adult birds in another colony. • Yes, because the colonies are separate from each other.
Part I: Regression questions 1 24.36 Sparrowhawk colonies. One of nature’s patterns connects the percent of adult birds in a colony that return from the previous year and the number of new adults that join the colony. Can the percent of returning adult birds be use to predict the number of new adults that join the colony? Is the Normality condition for residuals met? Why or why not? • No, because there is an outlier in the residuals. • No, because the dotplot of the residuals is not bell-shaped symmetric. • Yes, because the largest standard deviation divided by the smallest is less than 2. • Yes, we see no outliers or strong skewness in the dotplot of the residuals.
Part I: Regression questions 1 24.36 Sparrowhawk colonies. One of nature’s patterns connects the percent of adult birds in a colony that return from the previous year and the number of new adults that join the colony. Can the percent of returning adult birds be use to predict the number of new adults that join the colony? Is the Normality condition for residuals met? Why or why not? • No, because there is an outlier in the residuals. • No, because the dotplot of the residuals is not bell-shaped symmetric. • Yes, because the largest standard deviation divided by the smallest is less than 2. • Yes, we see no outliers or strong skewness in the dotplot of the residuals.
Part I: Regression questions 1 24.36 Sparrowhawk colonies. One of nature’s patterns connects the percent of adult birds in a colony that return from the previous year and the number of new adults that join the colony. Can the percent of returning adult birds be use to predict the number of new adults that join the colony? Is the condition of equal variance met? Why or why not? • No, because there is a megaphone pattern in the residual plot. • No, because the histogram of the residuals is not bell-shaped symmetric. • Yes, because the largest standard deviation divided by the smallest is less than 2. • Yes, because there is no megaphone pattern in the residual plot.
Part I: Regression questions 1 24.36 Sparrowhawk colonies. One of nature’s patterns connects the percent of adult birds in a colony that return from the previous year and the number of new adults that join the colony. Can the percent of returning adult birds be use to predict the number of new adults that join the colony? Is the condition of equal variance met? Why or why not? • No, because there is a megaphone pattern in the residual plot. • No, because the histogram of the residuals is not bell-shaped symmetric. • Yes, because the largest standard deviation divided by the smallest is less than 2. • Yes, because there is no megaphone pattern in the residual plot.
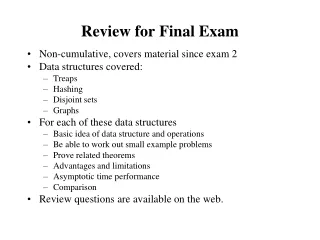
Simple linear regression results:Dependent Variable: New Adult BirdsIndependent Variable: Percent Return New Adult Birds = 31.934 - 0.3040 Percent Return Sample size: 13 R (correlation coefficient) = -0.7485 R-sq = 0.5602Estimate of error standard deviation: 3.6669 Parameter estimates: Predicted values:
Part I: Regression questions Using the regression printout, what are the values of the t test statistic and P-value for testing H0: β = 0 (slope)? • 31.93426, <0.0001 • 4.8376164, <0.0001 • –0.30402294, 0.0032 • 0.08122003, 0.0032 • –3.7432015, 0.0032
Part I: Regression questions Using the regression printout, what are the values of the t test statistic and P-value for testing H0: β = 0 (slope)? • 31.93426, <0.0001 • 4.8376164, <0.0001 • –0.30402294, 0.0032 • 0.08122003, 0.0032 • –3.7432015, 0.0032
Part I: Regression questions At a = 0.05 what conclusions can you make about whether we can use the percentage of returning birds to predict the number of new adult birds? Recall: H0: b = 0 • Reject H0 and conclude that the % of returning birds cannot be used to predict # of new adult birds. • Reject H0 and conclude that the % of returning birds can be used to predict # of new adult birds. • Fail to reject H0 and conclude that the % of returning birds cannot be used to predict # of new adult birds. • Fail to reject H0 and conclude that the % of returning birds can be used to predict # of new adult birds.
Part I: Regression questions At a = 0.05 what conclusions can you make about whether we can use the percentage of returning birds to predict the number of new adult birds? Recall: H0: b = 0 • Reject H0 and conclude that the % of returning birds cannot be used to predict # of new adult birds. • Reject H0 and conclude that the % of returning birds can be used to predict # of new adult birds. • Fail to reject H0 and conclude that the % of returning birds cannot be used to predict # of new adult birds. • Fail to reject H0 and conclude that the % of returning birds can be used to predict # of new adult birds.
Part I: Regression questions Y: # of new adult birds X: Percent of returning adult birds Interpret slope in context. • For each new adult bird that joins the colony, the % of adult birds returning decreases by 0.3%. • For every adult bird that returns, the number of new adults joining the colony decreases by 0.3 on average. • For each 1% increase in returning adult birds, the number of new adults decreases by 0.3 on average. • For each 0.3 new adult bird that joins the colony, the % of returning adult birds decreases by 1%.
Part I: Regression questions Y: # of new adult birds X: Percent of returning adult birds Interpret slope in context. • For each new adult bird that joins the colony, the % of adult birds returning decreases by 0.3%. • For every adult bird that returns, the number of new adults joining the colony decreases by 0.3 on average. • For each 1% increase in returning adult birds, the number of new adults decreases by 0.3 on average. • For each 0.3 new adult bird that joins the colony, the % of returning adult birds decreases by 1%.
Part I: Regression questions Y: # of new adult birds X: Percent of returning adult birds What is a 95% confidence interval for β (slope)? t* = 2.201 for df = n – 2 = 11 • 31.934 ± (2.201)(4.838) • 31.934 ± (2.201)(0.304) • -0.304 ± (2.201)(4.838) • -0.304 ± (2.201)(0.081)
Part I: Regression questions Y: # of new adult birds X: Percent of returning adult birds What is a 95% confidence interval for β (slope)? t* = 2.201 for df = n – 2 = 11 • 31.934 ± (2.201)(4.838) • 31.934 ± (2.201)(0.304) • -0.304 ± (2.201)(4.838) • -0.304 ± (2.201)(0.081)
Part I: Regression questions Y: # of new adult birds X: Percent of returning adult birds Interpret r2 in context. R-sq = 0.5602033 • 56% of the variation in percent of returning adult birds can be explained by number of new adult birds. • 56% of the variation in number of new adult birds can be explained by percent of returning adult birds. • 56% of the time, number of new adult birds can be used to predict percent of returning adult birds. • 56% of the time, percent of returning adult birds can be used to predict number of new adult birds.
Part I: Regression questions Y: # of new adult birds X: Percent of returning adult birds Interpret r2 in context. R-sq = 0.5602033 • 56% of the variation in percent of returning adult birds can be explained by number of new adult birds. • 56% of the variation in number of new adult birds can be explained by percent of returning adult birds. • 56% of the time, number of new adult birds can be used to predict percent of returning adult birds. • 56% of the time, percent of returning adult birds can be used to predict number of new adult birds.
Part I: Regression questions Y: # of new adult birds X: Percent of returning adult birds What is the predicted number of new adult birds in a colony when 60% of the birds return? • 189.780 • 50.174 • 18.240 • 13.694
Part I: Regression questions Y: # of new adult birds X: Percent of returning adult birds What is the predicted number of new adult birds in a colony when 60% of the birds return? • 189.780 • 50.174 • 18.240 • 13.694
Part I: Regression questions Y: # of new adult birds X: Percent of returning adult birds Predicted values: What is a 95% confidence interval for the mean number of new adult birds when the return rate is 60%? • (1.0271, 13.693) • (11.432, 15.954) • (5.312, 22.074)
Part I: Regression questions Y: # of new adult birds X: Percent of returning adult birds Predicted values: What is a 95% confidence interval for the mean number of new adult birds when the return rate is 60%? • (1.0271, 13.693) • (11.432, 15.954) • (5.312, 22.074)
Part I: Regression questions Y: # of new adult birds X: Percent of returning adult birds Predicted values: How does the 95% confidence interval for the mean number of new adult birds compare with the 95% prediction interval for the number of new adult birds when the return rate is 60%? • Both have the same width. • The 95% confidence interval for the mean is wider. • The 95% prediction interval for the number of new adult birds is wider.
Part I: Regression questions Y: # of new adult birds X: Percent of returning adult birds Predicted values: How does the 95% confidence interval for the mean number of new adult birds compare with the 95% prediction interval for the number of new adult birds when the return rate is 60%? • Both have the same width. • The 95% confidence interval for the mean is wider. • The 95% prediction interval for the number of new adult birds is wider.
Part II: 2 25.31 Nematodes and tomato plants. Do nematodes (microscopic worms) affect plant growth? A botanist prepares 16 identical planting pots and then randomly applies four different nematod treatments into four pots each. (The treatments are 0, 1, 5 and 10 nematods.) He transplants a randomly selected tomato seedling into each pot. For each plant he records the increase in height of the seedlings (in centimeters) 16 days after planting.
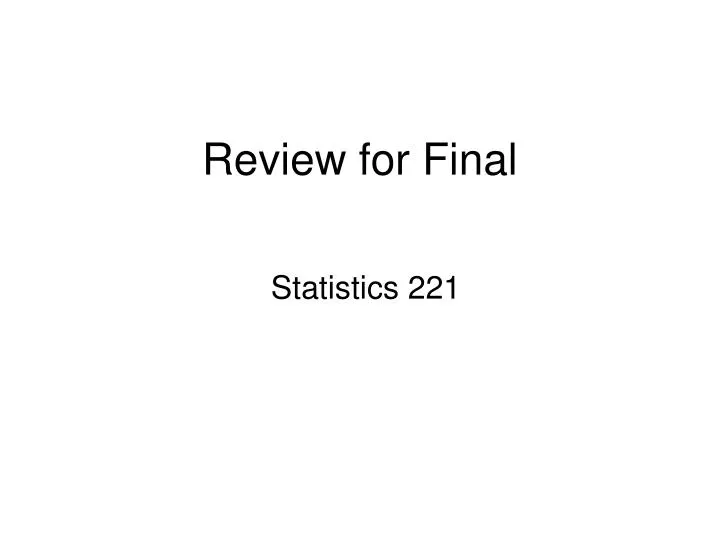
Analysis of Variance results: Factor means:
Part II: 2 25.31 Nematodes and tomato plants. Do nematodes (microscopic worms) affect plant growth? A botanist prepares 16 identical planting pots and then randomly applies four different nematod treatments into four pots each. (The treatments are 0, 1, 5 and 10 nematods.) He transplants a randomly selected tomato seedling into each pot. For each plant he records the increase in height of the seedlings (in centimeters) 16 days after planting. Is this an experiment or an observational study? Can we conclude causation? • experiment—can conclude causation • experiment—cannot conclude causation • observational study—can conclude causation • observational study—cannot conclude causation
Part II: 2 25.31 Nematodes and tomato plants. Do nematodes (microscopic worms) affect plant growth? A botanist prepares 16 identical planting pots and then randomly applies four different nematod treatments into four pots each. (The treatments are 0, 1, 5 and 10 nematods.) He transplants a randomly selected tomato seedling into each pot. For each plant he records the increase in height of the seedlings (in centimeters) 16 days after planting. Is this an experiment or an observational study? Can we conclude causation? • experiment—can conclude causation • experiment—cannot conclude causation • observational study—can conclude causation • observational study—cannot conclude causation
Part II: 2 25.31 Nematodes and tomato plants. Do nematodes (microscopic worms) affect plant growth? A botanist prepares 16 identical planting pots and then randomly applies four different nematod treatments into four pots each. (The treatments are 0, 1, 5 and 10 nematods.) He transplants a randomly selected tomato seedling into each pot. For each plant he records the increase in height of the seedlings (in centimeters) 16 days after planting. What is the response variable? What type of variable? • Number of nematodes—categorical • Number of nematodes—quantitative • Height of seedling—categorical • Height of seedling—quantitative
Part II: 2 25.31 Nematodes and tomato plants. Do nematodes (microscopic worms) affect plant growth? A botanist prepares 16 identical planting pots and then randomly applies four different nematod treatments into four pots each. (The treatments are 0, 1, 5 and 10 nematods.) He transplants a randomly selected tomato seedling into each pot. For each plant he records the increase in height of the seedlings (in centimeters) 16 days after planting. What is the response variable? What type of variable? • Number of nematodes—categorical • Number of nematodes—quantitative • Height of seedling—categorical • Height of seedling—quantitative
Part II: 2 25.31 Nematodes and tomato plants. Do nematodes (microscopic worms) affect plant growth? A botanist prepares 16 identical planting pots and then randomly applies four different nematod treatments into four pots each. (The treatments are 0, 1, 5 and 10 nematods.) He transplants a randomly selected tomato seedling into each pot. For each plant he records the increase in height of the seedlings (in centimeters) 16 days after planting. What is the explanatory variable? What type of variable? • Nematode treatments—categorical • Nematode treatments—quantitative • Height of seedling—categorical • Height of seedling—quantitative
Part II: 2 25.31 Nematodes and tomato plants. Do nematodes (microscopic worms) affect plant growth? A botanist prepares 16 identical planting pots and then randomly applies four different nematod treatments into four pots each. (The treatments are 0, 1, 5 and 10 nematods.) He transplants a randomly selected tomato seedling into each pot. For each plant he records the increase in height of the seedlings (in centimeters) 16 days after planting. What is the explanatory variable? What type of variable? • Nematode treatments—categorical • Nematode treatments—quantitative • Height of seedling—categorical • Height of seedling—quantitative
Part II: 2 25.31 Nematodes and tomato plants. Do nematodes (microscopic worms) affect plant growth? A botanist prepares 16 identical planting pots and then randomly applies four different nematod treatments into four pots each. (The treatments are 0, 1, 5 and 10 nematods.) He transplants a randomly selected tomato seedling into each pot. For each plant he records the increase in height of the seedlings (in centimeters) 16 days after planting. What is the population of interest? • all nematodes • all tomato seedlings • all planting pots • all botanists