Download
1 / 1
10 likes | 184 Views
Stratosphere-to-Troposphere Transport Revealed by Ground-based Ozone Lidar (A21D-0100). Shi Kuang 1 , Mike Newchurch 1 , John Burris 2 , Kevin Knupp 1 , Lihua Wang 1 1 University of Alabama in Huntsville, 2 NASA/GSFC.

E N D
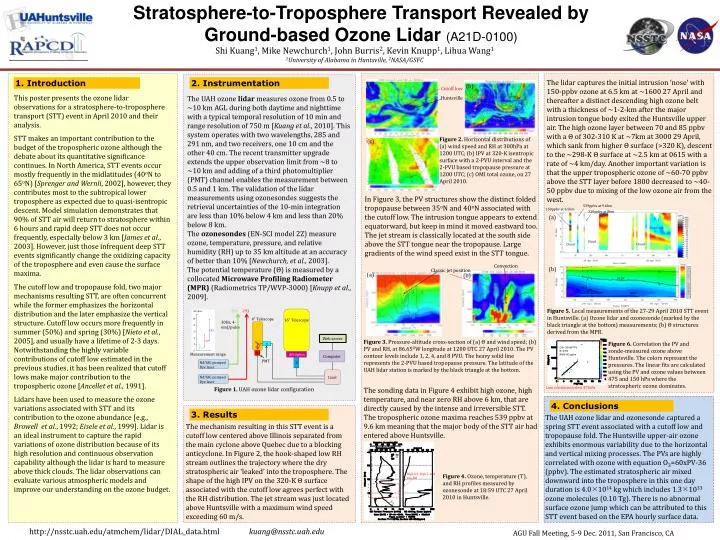
Stratosphere-to-Troposphere Transport Revealed by Ground-based Ozone Lidar(A21D-0100) Shi Kuang1, Mike Newchurch1, John Burris2, Kevin Knupp1, Lihua Wang1 1University of Alabama in Huntsville, 2NASA/GSFC This poster presents the ozone lidar observations for a stratosphere-to-troposphere transport (STT) event in April 2010 and their analysis. STT makes an important contribution to the budget of the tropospheric ozone although the debate about its quantitative significance continues. In North America, STT events occur mostly frequently in the midlatitudes(40oN to 65oN) [Sprenger and Wernli, 2002], however, they contributes most to the subtropical lower troposphere as expected due to quasi-isentropic descent. Model simulation demonstrates that 90% of STT air will return to stratosphere within 6 hours and rapid deep STT does not occur frequently, especially below 3 km [James et al., 2003]. However, just those infrequent deep STT events significantly change the oxidizing capacity of the troposphere and even cause the surface maxima. The cutoff low and tropopausefold, two major mechanisms resulting STT, are often concurrent while the former emphasizes the horizontal distribution and the later emphasize the vertical structure. Cutoff low occurs more frequently in summer (50%) and spring (30%) [Nieto et al., 2005], and usually have a lifetime of 2-3 days. Notwithstanding the highly variable contributions of cutoff low estimated in the previous studies, it has been realized that cutoff lows make major contribution to the tropospheric ozone [Ancelletet al., 1991]. Lidarshave been used to measure the ozone variations associated with STT and its contribution to the ozone abundance [e.g., Browell et al., 1992; Eisele et al., 1999]. Lidaris an ideal instrument to capture the rapid variations of ozone distribution because of its high resolution and continuous observation capability although the lidar is hard to measure above thick clouds. The lidar observations can evaluate various atmospheric models and improve our understanding on the ozone budget. The lidar captures the initial intrusion ‘nose’ with 150-ppbv ozone at 6.5 km at ~1600 27 April and thereafter a distinct descending high ozone belt with a thickness of ~1-2-km after the major intrusion tongue body exited the Huntsville upper air. The high ozone layer between 70 and 85 ppbv with a Θ of 302-310 K at ~7km at 3000 29 April, which sank from higher Θ surface (>320 K), descent to the ~298-K Θ surface at ~2.5 km at 0615 with a rate of ~4 km/day. Another important variation is that the upper tropospheric ozone of ~60-70 ppbv above the STT layer before 1800 decreased to ~40-50 ppbvdue to mixing of the low ozone air from the west. 1. Introduction 2. Instrumentation (a) (b) Cutoff low The UAH ozonelidarmeasures ozone from 0.5 to ~10 km AGL during both daytime and nighttime with a typical temporal resolution of 10 min and range resolution of 750 m [Kuang et al., 2010]. This system operates with two wavelengths, 285 and 291 nm, and two receivers, one 10 cm and the other 40 cm. The recent transmitter upgrade extends the upper observation limit from ~8 to ~10 km and adding of a third photomultiplier (PMT) channel enables the measurement between 0.5 and 1 km. The validation of the lidar measurements using ozonesondes suggests the retrieval uncertainties of the 10-min integration are less than 10% below 4 km and less than 20% below 8 km. The ozonesondes(EN-SCI model 2Z) measure ozone, temperature, pressure, and relative humidity (RH) up to 35 km altitude at an accuracy of better than 10% [Newchurch, et al., 2003]. The potential temperature (Θ) is measured by a collocated Microwave Profiling Radiometer (MPR) (RadiometricsTP/WVP-3000) [Knupp et al., 2009]. Huntsville Figure 2. Horizontal distributions of (a) wind speed and RH at 300hPa at 1200 UTC; (b) IPV at 320-K isentropic surface with a 2-PVU interval and the 2-PVU based tropopause pressure at 1200 UTC; (c) OMI total ozone, on 27 April 2010. (c) In Figure 3, the PV structures show the distinct folded tropopause between 35oN and 40oN associated with the cutoff low. The intrusion tongue appears to extend equatorward, but keep in mind it moved eastward too. The jet stream is classically located at the south side above the STT tongue near the tropopause. Large gradients of the wind speed exist in the STT tongue. 539ppbv at 9.6km 150ppbv at 6.5km 320ppbv at 8km (a) Cloud Cloud Cloud 291 285 Convection (b) Classic jet position 4” Telescope (a) (b) 16” Telescope 30Hz, 4-6mJ/pulse 302K Web server 1 Figure 5. Local measurements of the 27-29 April 2010 STT event in Huntsville. (a) Ozone lidar and ozonesonde (marked by the black triangle at the bottom) measurements; (b) Θ structures derived from the MPR. 2 Computer Aft Optics 3 PMT Nd:YAG pumped Dye laser Licel Figure 3. Pressure-altitude cross-section of (a) Θ and wind speed; (b) PV and RH, at 86.65OW longitude at 1200 UTC 27 April 2010. The PV contour levels include 1, 2, 4, and 8 PVU. The heavy solid line represents the 2-PVU based tropopause pressure. The latitude of the UAH lidar station is marked by the black triangle at the bottom. Nd:YAG pumped Dye laser Figure 6. Correlation the PV and sonde-measured ozone above Huntsville. The colors represent the pressures. The linear fits are calculated using the PV and ozone values between 475 and 150 hPa where the stratospheric ozone dominates. O3=-36+60*PV R=0.94 RMS=93 ppbv Figure 1. UAH ozone lidarconfiguration Measurement range Low correlation below 475hPa The sonding data in Figure 4 exhibit high ozone, high temperature, and near zero RH above 6 km, that are directly caused by the intense and irreversible STT. The tropospheric ozone maxima reaches 539 ppbv at 9.6 km meaning that the major body of the STT air had entered above Huntsville. 4. Conclusions 3. Results The UAH ozone lidar and ozonesonde captured a spring STT event associated with a cutoff low and tropopause fold. The Huntsville upper-air ozone exhibits enormous variability due to the horizontal and vertical mixing processes. The PVs are highly correlated with ozone with equation O3=60xPV-36 (ppbv). The estimated stratospheric air mixed downward into the troposphere in this one day duration is 4.01014 kg which includes 1.31033 ozone molecules (0.10 Tg). There is no abnormal surface ozone jump which can be attributed to this STT event based on the EPA hourly surface data. The mechanism resulting in this STT event is a cutoff low centered above Illinois separated from the main cyclone above Quebec due to a blocking anticyclone. In Figure 2, the hook-shaped low RH stream outlines the trajectory where the dry stratospheric air ‘leaked’ into the troposphere. The shape of the high IPV on the 320-K Θ surface associated with the cutoff low agrees perfect with the RH distribution. The jet stream was just located above Huntsville with a maximum wind speed exceeding 60 m/s. High O3, high T, and low RH Figure 4. Ozone, temperature (T), and RH profiles measured by ozonesonde at 18:59 UTC 27 April 2010 in Huntsville. AGU Fall Meeting, 5-9 Dec. 2011, San Francisco, CA http://nsstc.uah.edu/atmchem/lidar/DIAL_data.htmlkuang@nsstc.uah.edu