Download
1 / 33
330 likes | 557 Views
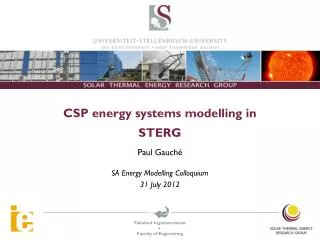
CSP energy systems modelling in STERG. Paul Gauché SA Energy Modelling Colloquium 31 July 2012. Introduction to STERG Why we do CSP systems modelling How we do plant and systems modelling What we can do and don’t/won’t do How we can collaborate. Agenda. Sterg introduction.

E N D
CSP energy systems modelling in STERG Paul Gauché SA Energy Modelling Colloquium 31 July 2012
Introduction to STERG Why we do CSP systems modelling How we do plant and systems modelling What we can do and don’t/won’t do How we can collaborate Agenda
STERG fits in here Stellenbosch University Engineering Mechanical Engineering DST/NRF CRSES (Renewable Centre) STERG • NEW: Eskom chair • Sasol researcher • DST/NRF spoke
STERG research structure STERG Holistic/Multidisciplinary Research Social & Political Sciences Engineering Economic Sciences SUNSTEL Stellenbosch University Solar Thermal Electricity Project (Primary projects: SUNSPOT, LFR) SWH, Process Heat, Desalination etc. System R&D (Modelling, Techno-economic, Resources, etc) Solar Resource Measure & R&D Component R&D: Eg. Dry Cooling Component R&D: Eg. Thermal Storage Component R&D: Eg. Heliostats, Receivers
Technology focus areas for R&D (and modelling) 11+ Projects from distribution to system to components focused on SUNSPOT
Experimental foundation 18 m tower Solar resource station
SA learned good lessons in last 15 years Struggle to bring IPP’s and renewables onto grid Introduced the Integrated resource plan, a robust planning process as law SA background Tender year IRP horizon IRP 2010 CSP Allocation Tender: 200 MW Total: 1,000 MW 2012 Tender: 100 MW? Total: 1,000 MW IRP 2 2013 Tender: 100 MW? Total: >1,000 MW? 2014 On-going… IRP 3 201x
IRP summary Capacity Electricity produced
Background GAP Sources: Grobbelaar, S., A road map for CSP industry development in South Africa: current policy gaps and recommended next steps for developing a competitive CSP industry, Essay, University of Cambridge, 2011. IRP2010. 2011. Integrated Resource Plan for Electricity 2010-2030. Government Gazette, Republic of South Africa, 6 May, 2011. Winkler (ed) 2007. Long Term Mitigation Scenarios: Technical Report. Prepared by the Energy Research Centre for Department of Environment Affairs and Tourism, Pretoria, October 2007.
CSP potential has been investigated by Fluri (short term) and Meyer & van Niekerk (longer term) Short term multi-constraint potential (500GWe+) vastly exceeds current or future electricity needs IRP 2010/11 allocates generously to renewables but not CSP – we see this as risk for baseload or peaking. This work extends previous work to explore full potential SA background
Based on Hubbert peak model – finite resources follow a normal distribution production curve. It works very well. Would have forecast British coal depletion to within months 100 years earlier. Rutledge coal model
South African coal What are these models saying? Peak coal: Now – 2020 Then it’s downhill to about mid century
Other resources (worldwide) Conventional uranium: ~2065 Other conventional and unconventional fuels also limited
Note: 2030 IRP annual power need =~ 500 TWh The wind resource is about 80 TWh Hydro is not a major source in SA Wave and ocean current is for the future Solar resource is immense and vastly exceeds future needs Both are intermittent and a problem This concludes the major energy sources Wind, water and solar
Making sense of it all CSP w Storage 900 CSP no storage 900 CSP Future >> 900 Wind 80 PV 900 Hydro 15 Coal 300 TWh 2030 energy needs OCGT 10 CCGT 10 Nuclear 77 TWh ~500 TWh
Dispatchability = storage + low inertia = CSP value prop 20 MWeGemasolar plant demonstrated 24h full load Introduction
Based on the Gemasolar plant • Approximated optical performance + Chambadal-Novikovengine (modified Carnot) + inertia capacitance + storage capacitance • Model validated using • eSolar measured data (Gauché et al. SolarPACES 2011) • NREL predicted annual electricity generation for this plant (110 vs. 115 GWh/yr) Method: Plant
Heliostat field Receiver balance Inertia & storage model Heat engine Method: Plant &
Plant model only requires 3 parameters for each hour for dry cooled plant (DNI, Tamb, wind) • Grid of points for all South Africa: • 0.375 ° increments latitude and longitude • 823 points in the boundaries of SA Method: Spatial solar and weather data
823 Grid points (uniform / unbiased) Pretoria Johannesburg Bloemfontein Durban Cape Town
Plant model only requires 3 parameters for each hour for dry cooled plant (DNI, Tamb, wind) • Grid of points for all South Africa: • 0.375 ° increments latitude and longitude • 823 points in the boundaries of SA • Helioclim-3 data derived from Meteosat • Real 2005 data (not TMY) • Point validation of wind and ambient temperature using SA weather data. • Sensitivity analysis to DNI, Tamb, wind showed strong sensitivity to DNI and very weak sensitivity to wind and Tamb. • Helioclim DNI data has issues. The method is still demonstrable. Method: Spatial solar and weather data
823 grid points * 3 parameters * 8760 hours = 21.6 million inputs • 1 output parameter (power) = 7.2 million outputs • Proxy for testing dispatchability • Run plant as-is (generates power when it can) • Half size power block (emulates half the 823 plants attempting to run at any 1 time) • Quarter size power block (emulates quarter of 823 plants attempting to run at any 1 time) • Some other combinations were tried Method: The spatial analysis
Results and analysis: Time plots 8 January days 8 June days
Results and analysis: Time plots Data anomaly 1 out of 4 plants running at a time practically demonstrates baseload
STERG centric (CRSES to some degree, but not SI) • Can do in future • Through partnerships: Real and TMY solar, wind* and weather data – multi year • CSP, PV & wind spatial and time modelling • GIS modelling for multi-criteria spatial type analysis • Develop and improve underlying technology models • Don’t / won’t do (as far as I can tell) • ERC-like TIMES modelling (stochastic, complex multi-criteria systems considerations) • Climate and climate change models • Anything in the policy or social space What we can do and don’t/won’t do
Collective database of • Discount rate sets for RE technologies (scenarios) • Capacity and capacity factor scenario sets for all options • Technology models • Conventional resource estimation scenarios (fossil and fissile) • Common solar, wind and weather data sets (real and TMY) • Demand profiles at least to hourly demand (historical and forecast) • Other… • For IRP • Set of assumptions on demand per year and finer resolution • Recognition of non electric energy needs that transition to electricity – particularly transport • Other… Areas for collaboration