Download
1 / 12
120 likes | 141 Views
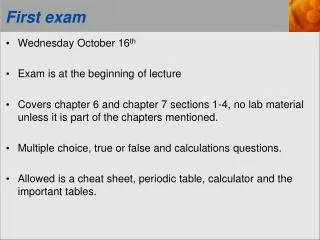
Find your assigned seat, leave belongings at the side, no calculators allowed, no leaving the room during the exam. Exam questions on opportunity cost, comparative advantage, specialization, exchange, and trade creating wealth.

E N D
First Exam Econ 160 Spring 2011
Instructions • Find your assigned seat using the seating chart. • All books, backpacks, notes, jackets, etc. should be left at the side of the room. • No calculators. • Once the exam has begun, you cannot leave the room before your turn in your exam.
Question 1 • Consider two farmers Chin and Chan. Chin is in Communist China and Chan in Kansas. On the next page the table shows how many pounds of corn Chin and Chan could grow on each acre of their farm if they planted rice and corn. • Compute the opportunity cost of producing rice and corn and fill in the empty table. Does comparative advantage exist? What is the pattern of comparative advantage? • Suppose Chin and Chan started off dividing the acreage on their farms evenly between rice and corn production and then fully specialized in the production of the crop in which they had a comparative advantage. Show the collective gain on the appropriate table. • After specialization according to comparative advantage, suppose Chin and Chan exchanged 100,000 lbs of corn for 75,000 lbs. of rice. Show the increase in consumption after specialization and exchange on your chart. What can you say about the distribution of the extra rice and corn produced? • Suppose the Communist Party in China pursued a policy of fixed exchange rates which shifted the price at which China sold rice to the United States so that instead of 100,000 lbs of corn for 75,000 lbs. of rice, China sold 100,000 lbs of rice for 100,000 corn. What is this doing to the price that Chin is getting for selling his crop? • Show how this would affect the distribution of the gains from specialization on your table. Does China end up better off as result of this policy? Explain.
How Trade Creates Wealth; Graphical Representation If the farmer and rancher specialize in the production of the good in which the have a comparative advantage and trade for the good in which they have a comparative disadvantage, they can enrich themselves collectively and individually. Rice (pounds) 300,000 At the exchange rate or 100,000 rice for 100,000 corn the USA still gets none of the increase in output from specialization and exchange 200,000 B (150K, 150K) 150,000 At the exchange rate or 75,000 rice for 100,000 corn the USA is worse off after exchange. A* (125K, 100K) 125,000 A (100K, 12.5K) 100,000 75,000 USA B* (75K, 200K) China 0 Corn (pounds) 25K 12.5K 100,000 200,000 300,000 150,000
Question 2 The tsunami partially destroyed the food crop/supply in Japan, shifting the supply curve from blue to green. This would cause the price of food in Japan to rise and set off reallocation of food from The Rest of The World to Japan (purple supply curve). If the nuclear disaster irradiated parts of the Japanese food supply, this would further reduce the supply of food in Japan, (green to red). This would raise the price of food even higher increasing the incentive of food owners in the rest of the world to ship food to Japan. There is no role for NGO’s in the process. Any interference in the free market will simply extend or deepen the food shortage in Japan Rest of World Africa Price Price Supply Supply P2 P3 P1 Demand Demand 0 0 Quantity Quantity
Controlled Price Shortage Question 3 The housing supply is not determined by the market. It is determined by the Soviet government Price Housing Supply Rather than being allocated by letting price rise so that supply equals demand, alternative allocation methods are used. Demand 0 Quantity
Reading the Online Grade Roster Normalized Exam Score is how many standard deviations away from the mean you are. Total points added to exam from all quizzes. Each quiz was worth a maximum of 10 points Raw score is the number of correct answers. Adjusted Quiz score is the percent of correct answers times 10.
Online Grade Roster-Current Grade Current Course Score is how many standard deviations away from the mean you are on all graded items up to this point in the semester. Grade if Course Ended Today is what grade you would receive right now based on how many standard deviations away from the mean you are averaging on all graded items up to this point in the semester.
Administrative Details. • There will be a mandatory one week cooling off period for any and all questions about the exam. After one week, if you want to discuss your exam you must come by office hours.