Download
1 / 31
310 likes | 446 Views
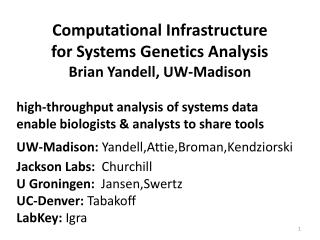
Professor Brian S. Yandell. joint faculty appointment across colleges: 50% Horticulture (CALS) 50% Statistics (Letters & Sciences) Biometry Program MS degree program across campus Consulting Facility across CALS & VETMED teaching & research statistical methods in biological sciences.

E N D
Professor Brian S. Yandell • joint faculty appointment across colleges: • 50% Horticulture (CALS) • 50% Statistics (Letters & Sciences) • Biometry Program • MS degree program across campus • Consulting Facility across CALS & VETMED • teaching & research • statistical methods in biological sciences
who am I (professionally)? • Professor Brian S. Yandell • joint appointment across colleges: • 50% Horticulture (CALS) • 50% Statistics (Letters & Sciences) • UW-Madison since 1982 • Biometry Program • teaching & research
MS Degree co-advise with biologist bridge biology & stats project & oral report consulting experience 10 completed, 1 current Genetics Botany, Dairy Sci (2), Hort, Land Resources, Meat & Animal Sci, Wildlife Ecology (2), Zoology Consulting Facility statistical consulting 5 faculty, 2-3 students computing assistance 2 staff + operators self-help model guide research ideas build skill sets collaboration students faculty staff CALS & VETMED & L+S Biometry Program
statistical genetics QTLs in Brassica time to flowering QTLs in mouse model diabetes model multiple generations micro-arrays 2 current students statistical ecology population ethology individual-based simulations stats consulting communication skills write, plot, talk bridge stats & biology linear models experimental design complicated analysis problems directly from consulting published textbook Research & Teaching
what is statistics? We may at once admit that any inference from the particular to the general must be attended with some degree of uncertainty, but this is not the same as to admit that such inference cannot be absolutely rigorous, for the nature and degree of the uncertainty may itself be capable of rigorous expression. — Sir Ronald A. Fisher (1935 The Design of Experiments) digital.library.adelaide.edu.au/coll/special/fisher
what is statistics? • There are three types of lies--lies, damn lies and statistics. • Benjamin Disraeli or Alfred Marshall or Mark Twain? (attributed) • Statistics is the science of science. (Bill Hunter) • Statistics is the science of learning from experience. (Brad Efron, inventor of the bootstrap)
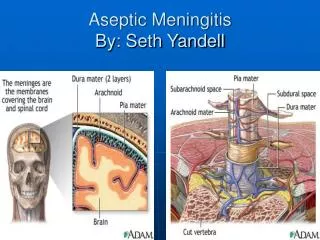
what is biology? Biology … consists of two rather different fields, mechanistic (functional) biology and historical [evolutionary] biology. Functional biology deals with … cellular processes, including those of the genome. … [Evolutionary biology] involve[s] the dimension of historical time. — Ernst Mayr at 100 (What Makes Biology Unique? 2004 Cambridge U Press)
what is bioinformatics? • emerging field interrelated with statistical genetics, computational biology and systems biology • goal: use computational methods to solve biological problems, usually on the molecular level • applied mathematics, informatics, statistics, computer science, artificial intelligence, chemistry and biochemistry • research on sequence alignment, gene finding, gene mapping, genome assembly, protein structure, gene expression and protein-protein interactions, modeling evolution http://en.wikipedia.org/wiki/Bioinformatics
Genome data analysis:how did I get involved? • how do plants modify flowering time? • intense collaboration • QTL gene mapping • Bayesian interval mapping methodology • subsequent to my involvement • fine mapping of FLC analogs in Brassica • sequencing of TO1000 genome • how do mice (humans) develop diabetes? • genetic association • QTL model selection • fine mapping: SORCS1 in mice & humans • biochemical pathways: • feature selection • causal models
Yandell “Lab” Projects • Bayesian QTL Model Selection • R software development (Whipple Neely) • collaboration with UAB & Jackson Labs • data analysis of SCD1, ins10 • meta-analysis for fine mapping Sorcs1 • Chr 19 QTL introgressed as congenic lines • combined analysis across to increase power • QTL-based causal biochemical networks • algorithm development (Elias Chaibub) • data analysis with Jessica Byers
QTL mapping: idea • phenotype y depends on genotype q • pr(y | q, µ) • q may be multivariate (multiple QTL) • linear model in q (or semiparametric) • possible interactions among QTL (epistasis) • missing data: many genotypes q unknown • pr(q | m, ) • measure markers m linked to q (correlated) • form of genotype model well known
BC with 1 QTL: IM vs. BIM blue=ideal black=BIM purple=IM 2nd QTL? 2nd QTL?
glucose insulin (courtesy AD Attie)
studying diabetes in an F2 • mouse model: segregating panel from inbred lines • B6.ob x BTBR.ob F1 F2 • selected mice with ob/ob alleles at leptin gene (Chr 6) • sacrificed at 14 weeks, tissues preserved • physiological study (Stoehr et al. 2000 Diabetes) • mapped body weight, insulin, glucose at various ages • gene expression studies • RT-PCR for a few mRNA on 108 F2 mice liver tissues • (Lan et al. 2003 Diabetes; Lan et al. 2003 Genetics) • Affymetrix microarrays on 60 F2 mice liver tissues • U47 A & B chips, RMA normalization • design: selective phenotyping (Jin et al. 2004 Genetics)
“final” analysis for logins10 Df Sum Sq Mean Sq F value Pr(>F) Model 10 14.054 14.054 122.16 < 2.2e-16 ***Error 405 46.591 0.115 Total 415 60.645 14.169 Single term deletions Df Sum of Sq RSS F value Pr(F) <none> 46.59 sex 1 5.82 52.41 50.6234 5.115e-12 ***Chr2@84 1 1.37 47.97 11.9512 0.0006039 ***Chr5@36 1 1.47 48.06 12.8085 0.0003869 ***Chr8@30 1 0.04 46.63 0.3583 0.5497918 Chr16@36 1 0.95 47.54 8.2330 0.0043290 ** Chr17@54 1 0.10 46.69 0.8591 0.3545425 Chr19@43 1 0.09 46.69 0.8200 0.3657200 Chr8@30:Chr19@43 1 1.18 47.78 10.2969 0.0014386 ** Chr17@54:Chr19@43 1 0.58 47.17 5.0366 0.0253561 * sex:Chr19@43 1 0.36 46.96 3.1675 0.0758684 .
logins10: main effects for Chr 2,5,16(only additive part significant) p=0.0004 p=0.0008 p=0.004
QTL Meta-analysis in miceyields human diabetes target Susanne Clee, Brian Yandell, …, Mark Gray-Keller, …, Jerome Rotter, Alan Attie 1 November 2005
log10(ins10)Chr 19black=allblue=malered=female purple=sex-adjusted solid=512 micedashed=311 mice
Sorcs1 study in mice: 11 sub-congenic strains marker regression meta-analysis within-strain permutations Nature Genetics 2006
Sorcs1 study in humans Diabetes 2007
2M observations 30,000 traits 60 mice
QTL mappingthousandsof gene expression traitsPLoS Genetics 2006
Causal vs Reactive? (Elias Chaibub, Brian Yandell)y1 causes y2: y1 ~ g1 and y2 ~ g2*y1
7 phenotype6 edgecausal modelhow does correct edge orient vary over graph?