Sequence Alignment: Methods & Interpretation for Genetic Comparison
Learn how to compare genetic sequences using dot matrices, dynamic programming, and substitution matrices. Understand the importance of finding evolutionary relationships between genes and proteins. Discover how to interpret dot plots for structural similarities and functional alignments.


Sequence Alignment: Methods & Interpretation for Genetic Comparison
E N D
Presentation Transcript
Reading • Mount, Chapters 1, 2, and 3 (up to page 94)
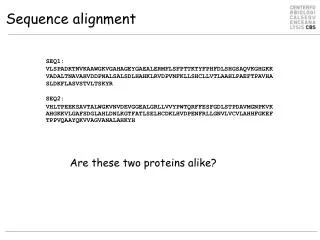
Why compare sequences? • To find whether two (or more) genes or proteins are evolutionarily related to each other • To find structurally or functionally similar regions within proteins
Similar genes arise by gene duplication • Copy of a gene inserted next to the original • Two copies mutate independently • Each can take on separate functions • All or part can be transferred from one part of genome to another
Sequence Comparison Methods • Dot matrix analysis • Dynamic Programming • Word or k-tuple methods (FASTA and BLAST)
Dot matrices c g g a c a c a c g
Interpretation • Regions of similarity appear as diagonal runs of dots • Reverse diagonals (perpendicular to diagonal) indicate inversions • Reverse diagonals crossing diagonals (Xs) indicate palindromes
Interpretation • Can link separate diagonals to form alignment with gaps • Each a.a. or base can only be used once • Can't double back • A gap is introduced by each vertical or horizontal skip
Filtering • Dot matrices for long sequences can be noisy due to insignificant matches • Solution: use a window and a threshold • compare character by character within a window (have to choose window size) • require certain fraction of matches within window in order to display it with a dot
Dot plot comparison using windows Window size = 11 Stringency = 7 (Put a dot only if 7 out of next 11 positions are identical.)
Uses for dot matrices • Aligning two proteins or two nucleic acid sequences • Finding amino acid repeats within a protein by comparing a protein sequence to itself • Repeats appear as a set of diagonal runs stacked vertically and/or horizontally
Repeats Human LDL receptor protein sequence (Genbank P01130) W = 1 S = 1 (Mount, Fig. 3.6)
Repeats W = 23 S = 7 (Mount, Fig. 3.6)
Using substitution matrices • Dots can have weights • Some matches are rewarded more than others, depending on likelihood • Use PAM or BLOSUM matrix (more on these later) • Put a dot only if a minimum total or average weight is achieved • See Mount, Fig. 3.5