Download
1 / 15
150 likes | 173 Views
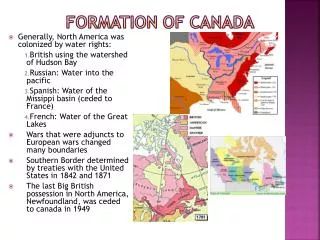
Determining Watershed Parameters for Water Rights in the Cypress River Basin. By: Hema Gopalan GIS in Water Resources (C E 394K) Fall 2001. Background. Development of Water Availability Model (WAM) by TNRCC. 2. The model should determine:. ?. ?. Whether sufficient water is available

E N D
Determining Watershed Parameters for Water Rights in the Cypress River Basin By: Hema Gopalan GIS in Water Resources (C E 394K) Fall 2001
Background • Development of Water Availability Model (WAM) by TNRCC 2. The model should determine: ? ? • Whether sufficient water is available • Amount of water for each water right • Percent of time it is available ?
WRAP model • TNRCC provides location of water rights, CRWR determines • Watershed parameters for those water rights and the contractor • uses the parameters to provide water availability data. • Wrap1117 project developed in ArcView 3.2 to establish • watershed parameters for water rights. • 19 out of the 22 basins completed.
Parameters • Upstream areaof each control point 2. Average upstream precipitation 3. Average upstream Curve Number 4. Connectivity of water rights 5. Flow length to outlet
The Mess Control points Stream network
Buffer zone and surrounding streams • The basin outline is buffered • by a 10 Km zone • This is to ensure all appropriate • areas are captured • All streams must drain • off the DEM for proper • grid processing
Grids Grids Grids!!! DEM grid Burn Grid Flow Accumulation grid Flow Direction grid Fill grid
More grids… Average precipitation Average CN
DEM stream network 64 32 128 Original stream network 1 16 8 2 4 DEM stream network
Snapped control points to DEM stream Snapped control points Original control points
Watershed Delineation Network created to determine connectivity between control points Watershed boundaries are delineated for each control point
Results Comparison of results with USGS data Percent difference should be less than 3 % HUC area for Gage 7346000 is 893Mi2
Acknowledgements Dr. Maidment Melissa Figurski Research group at CRWR