Download
1 / 75
760 likes | 879 Views
SUMMER SCHOOL OF NEUROSCIENCE PARKINSON’S DISEASE MULTIPLE DOMAINS EPIDEMIOLOGY AND RISK FACTORS IN PD Alessandra Nicoletti Dipartimento di Neuroscienze Università di Catania. Classification of Studies. Descriptive Studies. Analytic Studies. Experimental Studies . Frequency

E N D
SUMMER SCHOOL OF NEUROSCIENCE PARKINSON’S DISEASE MULTIPLE DOMAINS EPIDEMIOLOGY AND RISK FACTORS IN PD Alessandra Nicoletti Dipartimento di Neuroscienze Università di Catania
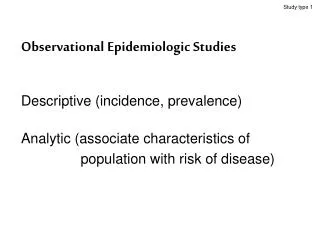
Classification of Studies Descriptive Studies Analytic Studies Experimental Studies • Frequency • (prevalence, incidence) • Distribution • ( time, place, person) • Test causal hypotheses • Uncontrolled assignment • Test causal hypotheses • Controlled assignment Population Survey Clinical Trial Case-Control Study Cohort Study
Epidemiology of PDDescrittive studies • Prevalence • 31.4/100.000 (Ashok et al. Libia) • 328/100.000 (Bharucha et al India) • Standardized rates 56-234/100.000 • Incidenza • 4.9/100.000 (Rosati, Sardegna) • 23.8/100.000 (Rajput et al. 1984)
Anatomy of the Population Surveys Define the population • Sampling • Complete enumeration • Probability (“random”) sample • Simple • Stratified • systematic Define the disease • Diagnostic criteria Ascertain cases • Counting of exsisting diagnosis • Hospitals and other institutions • Hospitals + specialists + generalists + drug use • Records-linkage system • Direct contact survey (door-to-door) • Two phase (screening and exam.)
PARKINSON’S DISEASEAge and diagnostic criteria de Rijk 1997
Case-finding • general surveys: GP’s Rosters, hospital registries etc • door-to-door surveys: direct interview of all people in the study population
Prevalence of PD GENERAL SURVEYS Cases /100.000 inhabitants
Prevalence of PD Door-to-door Cases/100.000 inhabitants
Eligible population 26,692 SNES Survey PHASE I Screened population 19,955 Negative 19,295 Positive 660 PHASEII Diagnosis of syndrome = 91 Parkinson Disease = 63 Secondary Parkinsonism = 21 Unspecified = 21 Prevalence of PD 257/100,000 Morgante et al. 1992
Eligible population 10 124 Screened population 9 955 PHASE I Negative 8 823 Positive 1 130 PHASEII Parkinson Disease = 5 Prevalence = 50.2/100,000 Nicoletti et al., 1998 Nicoletti et al., 2003
Structure of the study population Standardization Bolivian population Sicilian population
Epidemiology of PDDescrittive studies • Prevalence • 31.4/100.000 (Ashok et al. Libia) • 328/100.000 (Bharucha et al India) • Standardized rates 56-234/100.000 • Incidenza • 4.9/100.000 (Rosati, Sardegna) • 23.8/100.000 (Rajput et al. 1984)
Incidence of PD GENERAL SURVEYS New cases per 100.000 inhabitants per year
Prospective population-based incidence studies of Parkinson’s disease
Survival (159 PD patinets and 301 controls) Boston, 1984-92 FOLLOW-UP Bennett, 1996 N Engl J Med
Survival (220 parkinsonian patinets and 421 controls)Inghilterra e Galles, studio prospettico 1984-92 FOLLOW-UP Ben-Shlomo e Marmot, 1995 JNNP
Summary • prevalence of PD in industrialised countries is generally estimated at 300/100.000 of the entire population • about 1000/100.000% in people over 60 years • higher prevalence of PD in men than in women • incidence rates of PD are 8–18 per 100 000 person-years. • less common in black and Asian people than in white people
Classification of Studies Descriptive Study Analytic Study Experimental Study • In populations • Frequency • (prevalence, incidence) • Distribution • (by time, place, person) • In Individuals • Test causal hypotheses • Uncontrolled assignment • In Individuals • Test causal hypotheses • Controlled assignment The Population Survey The Clinical Trial The Case-Control Study The Cohort Study
SMOKERS NON SMOKERS + + + + + + + Lung Cancer No Lung Cancer Lung Cancer No Lung Cancer Cohort study
Measures of Risk:Relative Risk • The risk ratio compares the incidence risk of an outcome in two populations. • It is often used in analytical studies to compare the incidence risk of an outcome in a population exposed to a suspected risk factor with the incidence risk of the outcome in a population not exposed to the factor. • RR (Risk ratio) = incidence risk in exposed population incidence risk in unexposed population • It is a measure of the strength of the association between the exposure and the outcome.
Is there an association? • RR = 1 If the relative risk is 1, then the risk in exposed and unexposed persons is the same. In these circumstances there is no evidence of an association between the exposure and the outcome. • RR > 1 If a relative risk is greater than 1, this tells us that in our study the risk in exposed persons is greater than the risk in unexposed persons. This is evidence of a positive association between the exposure and the outcome. The higher the number is above 1, the stronger the positive association. • RR < 1 If a relative risk is less than 1, this tells us that in our study the risk in exposed persons is less than the risk in unexposed persons. This is evidence of a negative association between the exposure and the outcome. The lower the number is below 1, the stronger the negative association.
Unexposed Exposed Unexposed Exposed + + + + + + + + + + + + + + + ++ + +++ + + ++ + ++ +++ + Cases Controls Case-control study
Is there an association? • OR = 1 If the relative risk is 1, then the risk in exposed and unexposed persons is the same. In these circumstances there is no evidence of an association between the exposure and the outcome. • OR > 1 If a relative risk is greater than 1, this tells us that in our study the risk in exposed persons is greater than the risk in unexposed persons. This is evidence of a positive association between the exposure and the outcome. The higher the number is above 1, the stronger the positive association. • OR < 1 If a relative risk is less than 1, this tells us that in our study the risk in exposed persons is less than the risk in unexposed persons. This is evidence of a negative association between the exposure and the outcome. The lower the number is below 1, the stronger the negative association.
Advantages exposure is measured at the start of the study, before the outcome occurs cohort studies can provide data on the time course of the development of the outcome(s), including late effects. more than one outcome can be examined at once rare exposures can be investigated using appropriately selected populations. Disadvantages prospective cohorts are slow and potentially expensive if there is a long period between exposure and outcome they are inefficient for rare diseases exposure status may change during study differential loss to follow-up may introduce bias: this is a particular problem when follow-up is of long duration in long term cohort studies, it may be hard to ensure that diagnostic criteria remain consistent throughout the study Cohort study
Advantages can be carried out rapidly and relatively cheaply are useful for studying rare diseases can be used to study diseases with long latent periods can study multiple exposures for a single outcome Disadvantages are prone to selection bias (controls) are prone to information bias (exposure status is determined after the outcome) cannot establish the sequence of events (the exposure may be a consequence rather than a cause of the outcome) are not suitable for studying rare exposures cannot usually be used to estimate disease incidence or prevalence Case-control studies
What does this association mean? Finding an association between an exposure and an outcome is only the first step in an analytical study. An association between an exposure and an outcome does not necessarily mean that the exposure causes the outcome.
What does this association mean? Association between exposure and outcome Confoundings Bias Role of chance Restriction Matching Randomisation stratification regression modelling Sample size Type I error (level of significance) Type II error (power) Selection bias Information bias
How to assess presence of confounding: Is coffee consumption associated with the risk of lung cancer? COFFEE DRINKING LUNG CANCER + + Smoking
Idiophatic PD • 5-10% monogenic familial PD • 90% Sporadic PD Genetic factors Environmental factors Complex gene-envornmental interaction
Chronic Parkinsonism in humans due to a product of meperidine-analog synthesis Four persons developed marked parkinsonism after using an illicit drug intravenously. Analysis of the substance injected by two of these patients revealed primarily 1-methyl-4-phenyl-1,2,5,6 tetrahydropyridine (MPTP) with trace amounts of 1-methyl-4 phenyl-4-propionoxy-piperidine (MPPP). On the basis of the striking parkinsonian features observed in our patients, and additional pathological data from one previously reported case, it is proposed that this chemical selectively damages cells in the substantia nigra. Langston JW, et al Science 1983
Parkinson’s diseaseRisk and Protective factors + - Increasing age Family history Male sex Farming/pesticide Head trauma Cigarette smoking Coffee drinking Alcohol Hormonal use
PD: Analytic studies Lancet Neurology 2006
Case-control studies Meta OR (95% CI) • Pesticide exposure (n=19) 1.9 (1.5-2.5) USA 2.2 (1.1-4.1) Canada 1.9 (1.4-2.8) Europe 1.8 (1.4-2.2) Asia 2.5 (1.6-4.1) • Farming (n=18) 1.4 (1.1-1.9) • Rural living (n=16) 1.6 (1.2-2.1) • Well water (n=18) 1.3 (0.9-1.6) Priyadarshi et al, 2000, 2001
Reproductive and hormonal factors • Higher incidence in men that in women • Inverse association between ERT and AD in post-menopausal women • Laboratory data
Estrogen replacement therapy * Natural menopause only
Dietary factors • Antioxidants • Fat and fatty acids • Dietary iron • Dietary factors related to homocysteine metabolism • Inflammation • Oestrogens • PD and cancer
Population-based prospective studies of smoking Lancet Neurol 2006; 5: 525–35
Population-based prospective studies of coffee consumption Lancet Neurol 2006; 5: 525–35
Population-based prospective studies of alcohol consumption Lancet Neurol 2006; 5: 525–35
The Role of Environmental Risk Factors in Parkinson Disease:What Is the Evidence? • Nicotine: In animal models, nicotine increases the presence of factors that have a neuroprotective effect on DA neurons (Maggio et al. 1998). Nicotine is an antioxidant (Ferger et al. 1998) and is an inhibitor of monoamine oxidase B that activates MPTP neuorotoxicity (Yong and Perry 1986). • Caffeine: Mice treated with caffeine before exposure to MPTP had reduced DA cell loss compared with mice unexposed to caffeine (Chen et al. 2001). The action of caffeine seems to be mediated through a blocking action on adenosine-A2 receptors (Schwarzschild et al. 2002) Logroscino G 2005
Cause-effect bias Presymptomatic phase Reduced smoking OR (95% CI) Never smoker 1.0 (Ref.) Ex-smoker, stopped <18 years 0.7 (0.4-1.2) Ex-smoker, stopped >18 years 0.6 (0.3-0.9) Current smoker 0.5 (0.2-0.9) Galanaud et al, 2004 INCIDENCE-PREVALENCE BIAS Death RR death Controls Non smokers 1.0 Controls Smokers 1.7 Cases Non smokers 2.3 Cases Smokers 2.0 Incident PD cases Smoking Prevalent PD cases Elbaz et al, 2003
CONFOUNDING BIAS Low dopamine level or other origin PD - Pre-morbid personality (“novelly seeking”) - Depression, anxiety Reduced smoking Smoking intolerance Reduced smoking Susceptibility genes PD
Genetic epidemiology • Familial aggregation studies • Twin studies • Linkage analysis • Disease genotype association studies