Download
1 / 30
310 likes | 485 Views
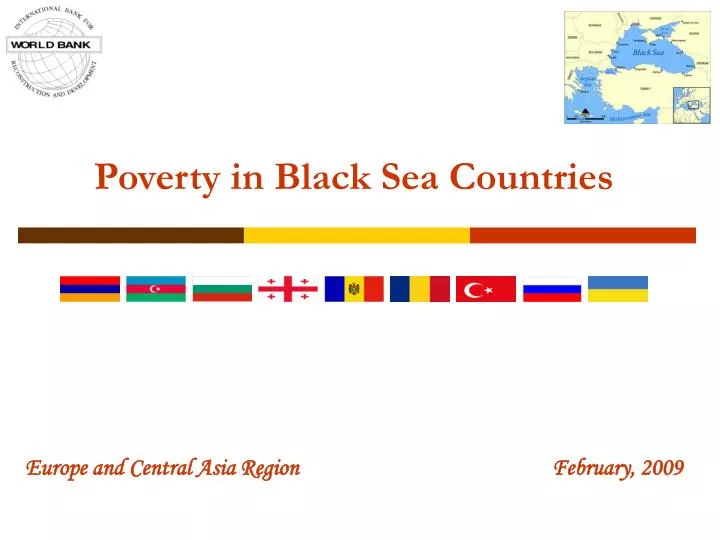
Poverty in Black Sea Countries. February, 2009. Europe and Central Asia Region. Key Messages (1). Economic growth with stable inequality (so far!) have dramatically reduced poverty in Black Sea area since 2002 to 2006 - 16m fewer poor and 27m fewer vulnerable.

E N D
Poverty in Black Sea Countries February, 2009 Europe and Central Asia Region
Key Messages (1) • Economic growth with stable inequality (so far!) have dramatically reduced poverty in Black Sea area since 2002 to 2006 - 16m fewer poor and 27m fewer vulnerable. • Note: Black Sea for this presentation includes: Armenia, Azerbaijan, Bulgaria, Georgia, Moldova, Romania, Turkey, Russian Federation, Ukraine
Key Messages (2) • BUT three major concerns loom: • One-third of the Region’s population was poor (27M) or vulnerable (87m) • Global crisis – financial commodities, food, etc have significant impact on poverty. Close to 6 million people are projected to remain in poverty in 2009-10. • Growing inequality within many countries threatens to slow down the pace of the future poverty reduction and social cohesion .
Black Sea Total ECA Share Black Countries Countries Sea to Total A B A/B Number of Countries 9 28 32% Total Population (millions) 313 477 66% Poor Population less than $2.5 a day (millions) 27 48 56% Vulnerable Population $2.5-$5 a day (millions) 87 135 65% Non Poor Population $5 plus a day (millions) 198 294 67% Poverty & Vulnerability Rates (Including Russian Federation) Poverty Rates (less than $2.5 a day) 8.6 10.0 86% Vulnerability Rates ($2.5-$5 a day) 27.9 28.3 99% Poverty & Vulnerability Rates Excluding Russian Federation Poverty Rates 12.2 10.0 121% Vulnerability Rates 33.5 28.3 118% Key Figures
Between 2002 and 2006, poverty incidence in Black Sea fell by almost 16M and vulnerability by 27M comparable to the trend observed in ECA region Source: Bank staff estimates based upon ECA Household Data Archives and 2005 ICPs.
MICs and EU countries in Black Sea region show the biggest falls in poverty and vulnerability
Ukraine, Romania, Azerbaijan and Russia have the highest reduction in Poverty and Vulnerability, Georgia and Turkey have the lowest
Russia and Turkey with two-thirds of the population also have two-thirds of the poor and the vulnerable
Poverty is increasingly rural in most countries , while gaps between rural and urban poverty differ significantly across countries • Source: Ravallion (2007)
Within-country differences between regions are increasing in most countries
Labor market gains are important for the poor – primarily from the growth in real wages Net monthly wages per capita
...as net job creation was scarce Employment rates by consumption deciles, %
Public transfers are higher in real terms and likely to have increased incomes of the poor • pension benefits up • number of pensioners is higher • social assistance higher
Other aspects of well-being have also improved • Access to education, health and essential infrastructure such as water, electricity and phones have improved substantially. • However there are two main concerns: • Quality of services have not improved with expectations • Lingering concerns over corruption and unequal treatment • Example: Access to Justice
Reduction in prevalence of informal payments resulted in substantial increase in utilization rates (2001-2006) Source: Sundaram, R. and S. Zaidi (forthcoming) Satisfaction with Publicly Provided Health Services in Eastern Europe and the former Soviet Union
A) However, there are significant risks to poverty reduction: • current economic crisis – short to medium term risk: • Macro impacts • Growth slowdown –possibility of contractions in some countries • Reduction in Exports, FDI flows and remittances • Tighter liquidity concerns for governments (foreign service), firms (credit and trade finance) • Micro (or Households impacts) • Income/wages slowdown and/or losses of jobs • Sectoral displacements – contraction in sectors where poor are largely employed (e.g. construction, trade, commodities); • Loss of remittances • Difficulties in mortgage repayment compounded by currency depreciation • Loss of pension assets invested in stock markets • All lead to substantial impact on productivity, poverty and vulnerability
Poverty will remain stagnant in the region in 2009 and in 2010. Close to 6 million people in Black Sea region will not be able to get out of poverty in 2009-10 following the crisis.
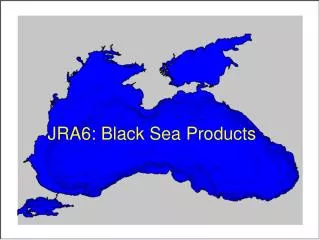
B) Multiple impacts of climate change and entry points for policy response
Top 25 « footprints » Top 25 « footprints » ) ) (WRI/Pew Center; data for 2000 (WRI/Pew Center; data for 2000 Top 25 in Top 25 in GDP Netherlands, Population (Taiwan) Thailand Canada , USA, China, EU25, Rep. Korea, Russia, India, Japan, Bangladesh, Australia , Germany, Brazil, UK, Nigeria, S. Africa , Italy, Mexico, France , Viet Nam, Spain, Indonesia, Iran, Philippines, Poland, Turkey Ethiopia, Argentina Egypt, Congo Top 25 in Ukraine, Emissions Pakistan Saudi Arabia (excl. LUCF) PRE - FINAL 070607 8 Climate change profile for ECA In a global context, the EU-25, Russia, Turkey, Ukraine and Poland rank among the top 25 countries for global carbon emissions, population (except Poland) and GDP (except Ukraine).
Climate change – systemic and longer term • Temperatures – expected to be hotter, with more extremes • Means • Mean temperatures will increase everywhere (most rapidly in the north), • Precipitations will decrease in the south, and increase in the north • Extremes • Weather extremes will be more frequent (droughts, floods, wind storm, heat waves)
Temperature changes in Europe around 2100 (A1B scenario) Source: D. Jacob, Max Planck Institute; http://www.climate-water-adaptation-berlin2007.org/documents/jacob.pdf A1B scenario is the third worst socio-economic scenario of the six developed by the IPCC
Likely geophysical impacts • More difficult water resource management: • Glacier melting • Flooding (especially Central Europe; central Russia?) • Droughts (southern Europe) • All of which will affect ability to provide sanitation and (drinking) water • Melting permafrost (Russia) • Vulnerable low lying coastal areas (from rising sea levels and coastal storm surges - Baltics, Romania, Turkey…)
Precipitation changes in Europe around 2100 (A1B scenario) Source: D. Jacob, Max Planck Institute; http://www.climate-water-adaptation-berlin2007.org/documents/jacob.pdf A1B scenario is the third worst socio-economic scenario of the six developed by the IPCC
What needs to be done • Enhance social protection • Continue strengthen social safety by increasing the efficiency and staying within available public resources • Targeted interventions by marginalized groups and minorities • Ensure adequate minimum wages sensitive to labor market conditions • Monitor progress • Maintain affords to collect more comprehensive data • Improve quality, coverage and address non-response • Monitor trends in quality of public services • Provide open access ____________
What needs to be done (2) • On climate change: Adaptation can significantly reduce economic losses and poverty impacts • Mitigation efforts reduce emissions or enhance the capture of emissions, thereby reducing escalation of impacts • Even the most ambitious global mitigation will not be sufficient, however, and adaptation programs are needed so that populations and critical ecosystems cope with residual impacts • Reforestation and investments in clean energy can provide mitigation and adaptation benefits