NOTE: Weights are from random effects analysis
Study. %. %. ID. OR (95% CI). Weight. Weight. IA. Jian J (2000). 2.90 (1.90, 4.40). 2.90 (1.90, 4.40). 4.10. 4.10. Sanderson M (2001). 0.90 (0.70, 1.20). 0.90 (0.70, 1.20). 11.43. 11.43. Zhang XJ (2001). 2.90 (1.90, 4.40). 2.90 (1.90, 4.40). 4.10. 4.10. Ye Z (2002).

NOTE: Weights are from random effects analysis
E N D
Presentation Transcript
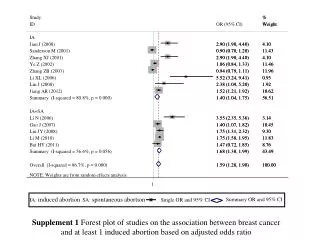
Study % % ID OR (95% CI) Weight Weight IA Jian J (2000) 2.90 (1.90, 4.40) 2.90 (1.90, 4.40) 4.10 4.10 Sanderson M (2001) 0.90 (0.70, 1.20) 0.90 (0.70, 1.20) 11.43 11.43 Zhang XJ (2001) 2.90 (1.90, 4.40) 2.90 (1.90, 4.40) 4.10 4.10 Ye Z (2002) 1.06 (0.84, 1.33) 1.06 (0.84, 1.33) 11.46 11.46 Zhang ZB (2003) 0.94 (0.79, 1.11) 0.94 (0.79, 1.11) 11.96 11.96 Li XL (2006) 5.52 (3.24, 9.41) 5.52 (3.24, 9.41) 0.93 0.93 Lin J (2008) 2.38 (1.09, 5.20) 2.38 (1.09, 5.20) 1.92 1.92 Jiang AR (2012) 1.52 (1.21, 1.92) 1.52 (1.21, 1.92) 10.62 10.62 Summary (I-squared = 80.8%, p = 0.000) 1.40 (1.04, 1.75) 1.40 (1.04, 1.75) 56.51 56.51 IA+SA Li N (2006) 3.55 (2.35, 5.36) 3.55 (2.35, 5.36) 3.14 3.14 Gao J (2007) 1.40 (1.07, 1.82) 1.40 (1.07, 1.82) 10.45 10.45 Liu JY (2008) 1.75 (1.31, 2.32) 1.75 (1.31, 2.32) 9.30 9.30 Li M (2010) 1.75 (1.58, 1.95) 1.75 (1.58, 1.95) 11.83 11.83 Bai HY (2011) 1.47 (0.72, 1.85) 1.47 (0.72, 1.85) 8.76 8.76 Summary (I-squared = 56.6%, p = 0.056) 1.68 (1.38, 1.99) 1.68 (1.38, 1.99) 43.49 43.49 Overall (I-squared = 86.7%, p = 0.000) 1.59 (1.28, 1.90) 1.59 (1.28, 1.90) 100.00 100.00 NOTE: Weights are from random effects analysis Supplement 1 Forest plot of studies on the association between breast cancer and at least 1 induced abortion based on adjusted odds ratio 1 IA: induced abortion SA: spontaneous abortion Summary OR and 95% CI Single OR and 95% CI