Lecture 15 Cluster analysis
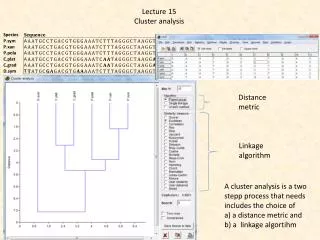
Lecture 15 Cluster analysis. Distance metric. Linkage algorithm. A cluster analysis is a two stepp process that needs includes the choice of a) a distance metric and b) a linkage algortihm. Within clusters. Between clusters.

Lecture 15 Cluster analysis
E N D
Presentation Transcript
Lecture 15 Clusteranalysis Distancemetric Linkagealgorithm A clusteranalysisis a twosteppprocessthatneedsincludesthechoice of a) adistancemetric and b) a linkagealgortihm
Withinclusters Betweenclusters Clusteranalysistries to minimizewithinclusterdistances and to maximizebetweenclusterdistances.
Thedistancemetric A distancematrixcountsinthesimplestcasethenumber of differencesbetweentwo data sets.
Speciespresence-absencematrix A Distancematrix D = ATA Soerensenindex Jaccardindex
Abundance data Correlationdistancematrix Due to squaringEuclideandistancesputparticulalryweight on outliers. Needs a linearscale. Euclideandistance The Manhattan distanceneedslinearscales. Despite of a largedistancethemetricmight be zero. Manhattan distance Correlationdistance Correlationsaresensitive to non-linearitiesinthe data. TheBray-Curtisdistanceisequivalent to theSoerensenindex for presence-absence data. Suffersfromthe same shortcoming as the Manhattan distance. Bray Curtis distance
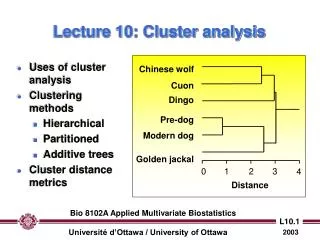
Linkagealgorithm We first combinespeciesthatarenearest to from an innercluster In thenext step we look for a speciesor a clusterthatisclostest to theaveragedistanceortheinitialcluster P.pola P.xan D.sym C.plat P.sym C.grad We continuethisprocedureuntilallspeciesaregrouped. Thesingle linkagealgorithmtends to produce many smallclusters.
Sequential versus simultaneous algorithms In simultaneous algorithms the final solution is obtained in a single step and not stepwise as in the single linkage above. Agglomeration versus division algorithmsAgglomerative procedures operate bottom up, division procedures top down. Monothetic versus polytheticalgorithmsPolythetic procedures use several descriptors of linkage, monothetic use the same at each step (for instance maximum association). Hierarchical versus non-hierarchical algorithms Hierarchical methods proceed in a non-overlapping way. During the linkage process all members of lower clusters are members of the next higher cluster. Non hierarchical methods proceed by optimization within group homogeneity. Hence they might include members not contained in higher order cluster. The single linkage algorithm uses the minimum distance between the members of two clusters as the measure of cluster distance. It favours chains of small clusters. The average linkage uses average distances between clusters. It gives frequently larger clusters. The most often used average linkage algorithm is the Unweighted Pair-Groups Method Average (UPGMA). The Ward algorithm calculates the total sum of squared deviations from the mean of a cluster and assigns members as to minimize this sum. The method gives often clusters of rather equal size. Median clustering tries to minimize within cluster variance.
Whichclusters to accept? To checkthe performance of differentclusteralgorithms and distancemetrics we use a matrix of random numbers.
Whichclusters to accept? We acceptthoseclustersthatarestableirrespective of algorithm. Differentclusteralgorithmsgivedifferentresults. In thecase of our random numbersclusteringisveryunstable.
Twomethodsdetectedtheclusters OP and ABC All otheritemsare not clearlyseparated. Theposition of item F remainsunclear
Clusteringusing a predefinednumber of clusters K-means B D A F C H E I G J K N L M O P K-meansclusteringstartsfrom a predefindnumber of clusters and thenarrangestheitemsin a waythatthedistancesbetweenclustersaremaximizedwithrespect to thedistanceswithintheclusters. Technicallythealgorithm first randomlyassignsclustermeans and thenplacesitems (each time calculatingnewclustermeans) until an optimalsolution (convergence) hasbeenreached). K-meansalwaysusesEuclideandistances
Neighbourjoining Neighbour joining is particularly used to generate phylogenetic trees You need similarities (phylogenetic distances) d(XY) between all elements X and Y. Dissimilarities Calculate Selectthepairwiththelowestvalue of Q Calculatenewdissimilarities Calculate the distancies from the new node
Home work and literature • Refresh: • Distancemetrics • Euclideandistance • Manhattan distance • UPGMA • Wardclustering • Neighborjoining • K-meanscluster Literature: http://en.wikipedia.org/wiki/Cluster_analysis http://statsoft.com/textbook/