Download
1 / 1
30 likes | 200 Views
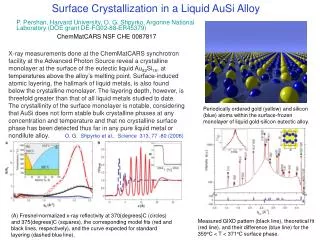
P. Pershan, Harvard University, O. G. Shpyrko, Argonne National Laboratory (DOE grant DE-FG02-88-ER45379) ChemMatCARS NSF CHE 0087817. Surface Crystallization in a Liquid AuSi Alloy.

E N D
P. Pershan, Harvard University, O. G. Shpyrko, Argonne National Laboratory (DOE grant DE-FG02-88-ER45379) ChemMatCARS NSF CHE 0087817 Surface Crystallization in a Liquid AuSi Alloy X-ray measurements done at the ChemMatCARS synchrotron facility at the Advanced Photon Source reveal a crystalline monolayer at the surface of the eutectic liquid Au82Si18, at temperatures above the alloy’s melting point. Surface-induced atomic layering, the hallmark of liquid metals, is also found below the crystalline monolayer. The layering depth, however, is threefold greater than that of all liquid metals studied to date. The crystallinity of the surface monolayer is notable, considering that AuSi does not form stable bulk crystalline phases at any concentration and temperature and that no crystalline surface phase has been detected thus far in any pure liquid metal or nondilute alloy. O. G. Shpyrko et al., Science 313, 77 -80 (2006) Periodically ordered gold (yellow) and silicon (blue) atoms within the surface-frozen monolayer of liquid gold-silicon eutectic alloy. (A) Fresnel-normalized x-ray reflectivity at 370{degrees}C (circles) and 375{degrees}C (squares), the corresponding model fits (red and black lines, respectively), and the curve expected for standard layering (dashed blue line). Measured GIXD pattern (black line), theoretical fit (red line), and their difference (blue line) for the 359oC < T < 371oC surface phase.