
Utilizing ASTER Remote Sensing for Assessing Seed Maturity in Native Seed Collections
This study explores the application of Advanced Spaceborne Thermal Emission and Reflectance (ASTER) imaging to assess seed maturity, specifically for Indian ricegrass (Achnatherum hymeniodes) in the context of native seed collections. Effective seed collection is vital for conservation efforts, yet achieving ideal genetic diversity remains a challenge. While previous research focused on plant phenology and physiology, this study aims to identify specific spectral signatures correlating with seed viability. Ultimately, it highlights the necessity for further investigation into remote sensing applications in seed maturation.

Utilizing ASTER Remote Sensing for Assessing Seed Maturity in Native Seed Collections
E N D
Presentation Transcript
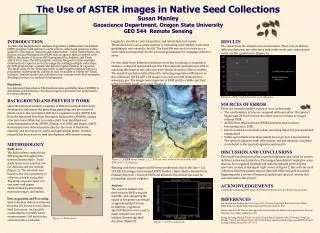
The Use of ASTER images in Native Seed Collections Susan Manley Geoscience Department, Oregon State University GEO 544 Remote Sensing INTRODUCTION In 2001, the Royal Botanic Gardens began Kew’s Millennium Seed Bank (MSB) program with partners world wide to collect and preserve native seeds for restoration, research and conservation. In the United States, the Bureau of Land Management (BLM) was an agency that partnered with MSB in the Seeds of Success (SOS) program (Fry, Seddon, and Vines, 2011). Over time, the SOS program evolved, the goal to make multiple collections of a species across its range. By making multiple collections, the SOS program has a genetically diverse representation of a species. The ideal scenario for collecting seeds would require multiple trips to a population. Unfortunately, collectors may be unable to follow the “ideal scenario” and the results are collections that contain seeds that are partly developed or have no embryo development. Hypothesis: Use Advanced Spaceborne Thermal Emission and Reflectance (ASTER) to determine seed maturity of Indian ricegrass (Achnatherum hymeniodes) for seed collection. BACKGROUND AND PREVIOUS WORK Since the launch of Landsat, a number of different methods have been developed to determine the phenology, physiology and processes of plants, such as the normalized difference vegetation index (NDVI) data from the Advanced Very High Resolution Radiometer (AVHRR), canopy structure from LiDAR, leaf area index (LAI) from Quickbird and evapotranspiration from AVHRR. (Zhang, et al 2003, and Jensen, 2007). Researchers have determined the date for the onset of bud burst, maturity, and dormancy for native and agricultural plants. Limited research has been done on seed development with remote sensing. METHODOLOGY Study Area: The BLM collects seeds for the SOS program throughout the western United States. Three study areas were selected, two in California and one in Utah, (Figure 1). The selection was based on the close proximity of collection sites to each other. The study areas are apart of a vast semi-arid region characterized by alternating mountain ranges and valleys. Data Acquisition and Processing: Seed collection data was obtained from the U.S. Forest Service, Bend Seed Extractory. An Excel file containing the scientific name, common name, SOS seed codes, collection dates, latitudes, • RESULTS • The values from the analysis were inconclusive. There was no distinct difference between the collections with viable seeds and undeveloped seeds, see the graph below (Figure 4). • Figure 4—Z Plot results from four seed collections. • SOURCES OF ERROR • There are several possible sources of error in this study. • The small number of sites to compared with each other. This project began with 20, but for most sites there were no images or images without VNIR. • ASTER Short Wave Infrared (SWIR) detectors have not been functioning since 2008. • Errors could have occurred as data was being imported, processed and manipulated . • Unlike agricultural areas these plants do not grow in a monoculture. The spectral signature from other plants, soil and minerals could have contributed to the spectral signature and results. • DISCUSSION AND CONCLUSIONS • This study was designed to find a spectral signature that could be used to facilitate native seed collection. The images have distinct vegetative areas that can be recognized by bright red with the infrared portion of the spectrum, as seen in the upper right corner of Figure 2, but, with the seed collection sites this pattern was not detected. More research is needed. Beginning with a review of temporal, spatial and spectral criteria that was selected for this project. • ACKNOWLEDGEMENTS • I would like to thank Kayla Herriman of the Bend Seed Extractory for the data she provided. • REFERENCES • Fry, Carolyn, Sue Seddon, and Gail Vines. 2011. The Last Great Plant Hunt, the story of Kew’s Millennium Seed Bank. Kew Publishing, Royal Botanic Gardens, Kew. • Jensen, John R. 2007. Remote Sensing of the environment: an earth resource perspective. Pearson Education, Inc. Upper Saddle River, NJ. • Zhang, Xiaoyang, Mark A. Friedl , Crystal B. Schaaf, Alan H. Strahler, John C.F. Hodges, FengGao, Bradley C. Reed, and Alfredo Huete. 2003. Monitoring vegetation phenology using MODIS. Remote Sensing of Environment 84: 471 – 475 longitudes, elevations, percent purities, and tetrazoliumtest results. Tetrazoliumtest is an accurate method of estimating seed viability. A personal geodatabase was created in ArcGIS. The Excel file was used to create an x-y event table and imported into the personal geodatabase for mapping collection areas. For this study three different resolutions were key to making a comparative analysis—temporal, spatial and spectral. The temporal resolution was vital to matching the image to the collection date. Spatial resolution 30m or smaller. The spectral resolution with infrared for detecting vegetation differences in the collections. ASTER AST_L1B images were selected and obtained from www.usgs.gov. The images were imported in ENVI and the Visible and Near Infrared (VNIR) bands were used (Figure 2). Working with these images in ENVI were problematic due to the size—121, 594 KB. The images were resized, ENVI Toolbar > Basic Tools > Resized Data (Spatial/Spectral) > Selected VNIR and all bands, the default was used for resampling, nearest neighbor. Analysis: The spectral analysis was performed in ENVI using the Z profile and comparing the values at the green wavelength at approximately 0.65 µm. In addition, vegetation spectral libraries were used to make comparisons with wildrye (Leymus spp.)and dry grass (Figure 3). Figure 2—ASTER image, bands 3, 2, 1. The red circle denotes the area of the SOS-UT931-437-11 collection. 0-10 10-20 20-40 40-50 melt ponds Figure 1—Study Areas. Figure 3—ZPlot comparison..


