A. Arrays
A. Arrays. An array consists of elements and dimensions Elements: data that make up the array Dimension: the length, height, or depth of an array An array can have one or more dimensions and as many as (2 31 )–1 elements per dimension, memory permitting

A. Arrays
E N D
Presentation Transcript
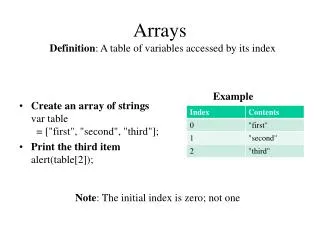
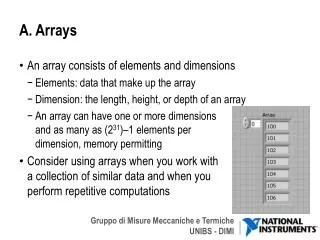
A. Arrays • An array consists of elements and dimensions • Elements: data that make up the array • Dimension: the length, height, or depth of an array • An array can have one or more dimensions and as many as (231)–1 elements per dimension, memory permitting • Consider using arrays when you work with a collection of similar data and when you perform repetitive computations
A. Arrays • The first element shown in the array (3.00) is at index 1 and the second element (1.00) is at index 2 • The element at index 0 is not shown in this image, because element 1 is selected in the index display • The element selected in the index display always refers to the element shown in the upper left corner of the element display
A. Arrays – Creating • Place an array shell on the front panel • Drag a data object or element into the array shell
A. Arrays – 2D Array • Stores elements in a grid • Requires a column index and a row index to locate an element, both of which are zero-based • To create a multidimensional array on the front panel, right-click the index display and select Add Dimension from the shortcut menu • You also can resize the index display until you have as many dimensions as you want
Summary—Quiz Answer • Which identifies the control or indicator on the block diagram? • Caption • Location • Label • Value
Summary—Quiz • Which structure must run at least one time? • While Loop • For Loop
Summary—Quiz Answer • Which structure must run at least one time? • While Loop • For Loop
Summary—Quiz • Which is only available on the block diagram? • Control • Constant • Indicator • Connector Pane
Summary—Quiz Answer • Which is only available on the block diagram? • Control • Constant • Indicator • Connector Pane
A. Arrays – Initializing • You can initialize an array, or leave it uninitialized • For initialized arrays, you define the number of elements in each dimension, and the contents of each element • Uninitialized arrays have dimension but no elements
A. Arrays – Creating Constants • To create an array constant: • Select an array constant on the Functions palette • Place the array shell on the block diagram • Place a constant in the array shell • You can use an array constant to store constant data or as a basis for comparison with another array • Array constants also are useful for passing data into a subVI
A. Arrays – Auto-indexing • If you wire an array to or from a For Loop or While Loop, you can link each iteration of the loop to an element in that array by enabling auto-indexing on tunnel • The tunnel changes from a solid square to the image shown above to indicate auto-indexing
A. Arrays – Auto-indexing Input For Loop executes a number of times equal to the number of elements in the array
A. Arrays – Auto-indexing Input • If the iteration count terminal is wired and arrays of different sizes are wired to auto-indexed tunnels, the actual number of iterations becomes the smallest of the choices.
A. Arrays – Auto-indexing Output • When you auto-index an array output tunnel, the output array receives a new element from every iteration of the loop • Auto-indexed output arrays are always equal in size to the number of iterations
A. Arrays – Creating 2D Arrays You can use two For Loops, one inside the other, to create a 2D array
B. Clusters • Clusters group data elements of mixed types • Similar to a record or a struct in text-based programming languages 19.10.2012
B. Clusters – Array vs Cluster • Clusters differ from arrays in that they are a fixed size • Clusters can contain mixed data types; arrays contain only one data type • Like an array, a cluster is either a control or an indicator and cannot contain a mixture of controls and indicators 19.10.2012
B. Clusters – Creating To create a cluster control or indicator on the front panel: • Place a cluster shell on the front panel • Drag a data object or element, which can be a numeric, Boolean, string, path, refnum, array, or cluster control or indicator into the cluster shell 19.10.2012
B. Clusters – Constants • To create a cluster constant: • Select a cluster constant on the Functions palette • Place the cluster shell on the block diagram • Place a constant in the cluster shell • If you have a cluster control or indicator, right-click the cluster on the block diagram and select Create»Constant from the shortcut menu 19.10.2012
B. Clusters – Order • Cluster elements have a logical order unrelated to their position in the shell • You can view and modify the cluster order by right-clicking the cluster border and selecting Reorder Controls In Cluster from the shortcut menu 19.10.2012
B. Clusters – Assembling a Cluster Use the Bundle function to assemble a new cluster 19.10.2012
B. Clusters – Modifying a Cluster Use the Bundle By Name or the Bundle function to modify an existing cluster 19.10.2012
B. Clusters – Disassembling a Cluster Use the Unbundle By Name or Unbundle function to use individual items in a cluster 19.10.2012
Practice • Create a newVIfrom scratch. • Using a cluster control simulate a randomreadingof temperature letting the userchooseaveragevalue, noiselevel, channelname. • Useanother cluster for the signalduration and the samplingfrequency. • Display the result in a chart, in a graph and asanaveragevalue
H. Plotting Data – Waveform Chart • Special type of numeric indicator that displays one or more plots of data, typically acquired at a constant rate • Displays single or multiple plots 19.10.2012
H. Plotting Data – Chart Update Modes • Right-click the chart and select Advanced»Update Mode from the shortcut menu • Strip chart is the default update mode • Scope chart and Sweep chart modes display plots significantly faster than the strip chart mode 19.10.2012
H. Plotting Data 19.10.2012
H. Plotting Data – Waveform Graphs Use the Context Help window to determine how to wire multi-plot data to Waveform Graphs and XY Graphs 19.10.2012
Practice • Update the previousVI in orderto create a variablenumberof temperature signals. • Rememberto update bothcontrols, indicatorsaccordingly • Usearraysofclusterswhenneeded!
G. Iterative Data Transfer • When programming with loops, you often need to know the values of data from previous iterations of the loop • Shift registers transfer values from one loop iteration to the next 19.10.2012
G. Iterative Data Transfer – Shift Registers • Right-click the border and select Add Shift Register from the shortcut menu • Right shift register stores data on completion of an iteration • Left shift register provides stored data at beginning of the next iteration 19.10.2012
G. Iterative Data Transfer – Stacked Shift Registers • Stacked shift registers remember values from multiple previous iterations and carry those values to the next iterations • Right-click the left shift register and select Add Element from the shortcut menu 19.10.2012
Practice Create a subVI able to average an input value with its previous values using a running average of given elements. INPUTs: dbl SIGNAL int ELEMENTS bool RESET OUTPUT: dbl FILTERED SIGNAL
G. Iterative Data Transfer – Initializing Run once VI finishes Run again 19.10.2012
G. Operational Global Variable effect A single-runwhileloopwithanuninitializedshiftregister can actas a staticvariable, recordingvaluefromoneiterationto the next In suchcases a reset functionisneededtoavoidconfusion
Practice Modify the thermostat vi in order to plot a running average (5 elements) of the signal