Download
1 / 10
160 likes | 505 Views
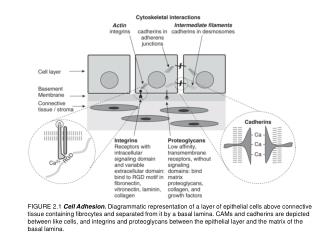
FIGURE 2.1 Cell Adhesion . Diagrammatic representation of a layer of epithelial cells above connective tissue containing fibrocytes and separated from it by a basal lamina. CAMs and cadherins are depicted

E N D
FIGURE 2.1 Cell Adhesion. Diagrammatic representation of a layer of epithelial cells above connective tissue containing fibrocytes and separated from it by a basal lamina. CAMs and cadherins are depicted between like cells, and integrins and proteoglycans between the epithelial layer and the matrix of the basal lamina.
FIGURE 2.2 Intercellular Junctions. Electron micrograph of culture of CA-KD cells, an early-passage culture from an adenocarcinoma secondary in brain (primary site unknown). Cells grown on Petriperm dish (Vivascience). (a) Desmosomes (D) between two cells in contact; mag. 28,000X. (b) Canaliculus showing tight junctions (T) and junctional complex (JC); mag. 18,500×. (Courtesy of Carolyn MacDonald.)
FIGURE 2.3 A549 Cells Growing on Matrigel. Cultures of A549 adenocarcinoma cells growing on Matrigel. (a) Low-power shot showing lattice formation 24 h after seeding at 1 × 10⁵ cells/mL. (b) Higher power, 3 days after seeding at 1 × 10⁵ cells/nil. Arrow indicates possible tubular formation. (Courtesy of Jane Sinclair; seealso Plate 12c.)
FIGURE 2.4 Cell Cycle. The cell cycle is divided into four phases: G1, S, G2 , and M. Progression round the cycle is driven by cyclins activated by cell division cycle kinases (Cdks), which in turn have been activated by regulatory genes, such as myc. Expression of positive-acting regulatory genes, such as myc, is induced by cytoplasmic signals initiated by receptor kinase following interaction with a mitogen, and transmitted via a signal transduction pathway, such as MAP kinase (a). The cell cycle is arrested at restriction points in G1 by the action of Rb, and other cell cycle inhibitors in the absence of mitogens (b). When these are inactivated, usually by phosphorylation (Rb∗), cells proceed round the cycle (a). The cell cycle can also be arrested at check points by cell cycle inhibitors such as and p53 if DNA damage is detected (c). Phosphorylation of p53 (p53∗) allows the cycle to proceed (a).
FIGURE 2.5 Differentiation and Proliferation. Cells in culture can be thought to be in a state of equilibrium between cell proliferation and differentiation. Normal culture conditions (low cell density, mitogens in the medium) will favor cell proliferation, while high cell density and addition of differentiation factors will induce differentiation. The position of the equilibrium will depend on culture conditions. Dedifferentiation of the culture may be due to the effect of growth factors or cytokines inducing a more proliferative phenotype, reprogramming of gene expression, or overgrowth of a precursor cell type.
FIGURE 2.6 Differentiation from Stem Cells. (a) In vivo, a small stem cell pool gives rise to a proliferating progenitor compartment that produces the differentiated cell pool. (b) In vitro, differentiation is limited by the need to proliferate, and the population becomes predominantly progenitor cells, although stem cells may also be present. Pluripotent stem cells (far left) have also been cultured from some tissues, but their relationship to the tissue stem cells is as yet unclear. Culture conditions select mainly for the proliferating progenitor cell compartment of the tissue or induce cells that are partially differentiated to revert to a progenitor status.
FIGURE 2.7 Commitment and Reversibility. A lineage stem cell, such as a myeloid/erythroid stem cell, an epidermal stem cell, or a neural stem cell, gives rise to one or more lineages by a process of commitment to a particular pathway. However, this process is no longer regarded as irreversible, and reversion of committed precursors to a common lineage stem cell or to a pluripotent or even totipotent stem cell is possible.
FIGURE 2.8 Cell Interaction and Signaling. Routes of interaction among cells. (a) Soluble factors include endocrine hormones from the vasculature, paracrine factors from the stroma, homocrine factors from adjacent similar cells, and autocrine factors from the cell itself. Matrix, soluble, and cell-associated heparan sulfate proteoglycans (HSPG) and proteoglycan receptors (PGR) may help the activation, stabilization, and translocation of paracrine factors. (b) Uniformity of response in target tissue is improved by gap junctional communication, by calcium signaling, and possibly by homocrine factors from the stimulated cell. (c) Contact mediated effects also include adherens junctions and tight junctions (associated in junctional complexes) and desmosomes. These, along with integrins, signal via the cytoskeleton, enforcing position, shape, and polarity.
FIGURE 2.9 Evolution of a Cell Line. The vertical (y) axis represents total cell growth (assuming no reduction at passage) for a hypothetical cell culture. Total cell number (cell yield) is represented on this axis on a log scale, and the time in culture is shown on the x axis on a linear scale. Although a continuous cell line is depicted as arising at 14 weeks, with different cells it could arise at any time. Likewise senescence may occur at any time, but for human diploid fibroblasts it is most likely to occur between 30 and 60 cell doublings, or 10 to 20 weeks, depending on the doubling time. Terms and definitions used are as in the glossary. (After Hayflick and Moorhead, 1961.)
FIGURE 2.10 Chromosome Numbers of Finite and Continuous Cell Lines. (a) A normal human glial cell line. (b) A continuous cell line from human metastatic melanoma.