Download
1 / 26
260 likes | 349 Views
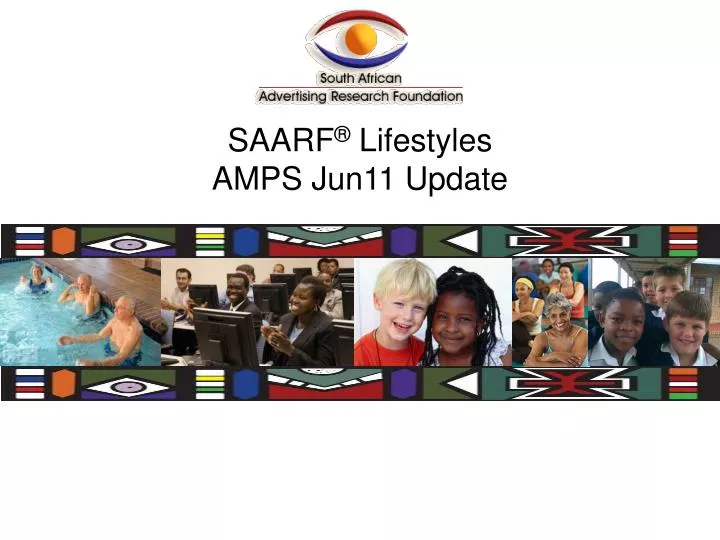
SAARF ® Lifestyles AMPS Jun11 Update. How were the SAARF Lifestyles determined ?. They are based on the attendance at and participation in 24 sports as well as the frequency of engaging in over 60 other activities Correlation and Factor Analysis were used. SAARF ® Lifestyle Groups.

E N D
How were the SAARF Lifestyles determined? • They are based on the attendance at and participation in 24 sports as well as the frequency of engaging in over 60 other activities • Correlation and Factor Analysis were used
SAARF® Lifestyle Groups • Cell Addicts (11.7%) • Sports (3.7%) • Good Living (11.8%) • Gamers (8%) • Outdoor (6.2%) • Studious (8.2%) 7. Traditionals (10.8%) 8. Homebodies (9.3%) • New Visual Media (11.5%) • Showgoers(5%) • Gardeners (11.8%)
SAARF® Lifestyle Groups x LSM LSM® 1-5 Lifestyles • Sports (1.5%) • Cell Addicts (5.9%) • Studious (4.1%) • Good Living (6.1%) • Gamers (3.7%) • Homebodies (5.1%) • Traditionals (5.3%) • Showgoers (6.2%) • Outdoor (2.6%) • New Visual Media (6.7%) LSM® 6-10 Lifestyles • Sports (2%) • Cell Addicts (6.3%) • Studious (4.2%) • Good Living (5.4%) • Gamers (4%) • Homebodies (4.3%) • Gardeners (9.6%) • Showgoers (2.4%) • Outdoor (3%) • Traditionals (5.6%) • New Visual Media (5.5%) • 12. Avid Readers (6.6%)
Cell Addicts • Defining characteristic is extensive use of cell phones • Mostly 15 -24 years old (54%) • Marginally more males (51%) • Mostly students (32%) • Mostly “At-Home Singles”
Cell Addicts High correlation & factor scores for the following cell phone activities: • Take photos • Download/listen to music • Take video recordings • Download ringtone/logo • Send an MMS • Browse WAP or Web • Use instant messaging/chat services • Send SMS • Play games • Send/receive email • Enter competitions/make donations • Send a “Please call me”
Sports • Defining characteristic is engagement in a variety of sporting activities • Mostly 15 -24 years old (44%), but up to 49 years old • Mostly male (61%) • Large number of students (27%) • High household LSM
Sports High correlation & factor scores for the following activities: Cricket Athletics Volleyball Tennis Rugby Jogging/running Walking/hiking Aerobics Basketball/netball Dancing Fishing • Soccer • Hockey • Adventure sports • Horse riding • Water sports • Martial arts • Hunting/shooting • Boxing/wrestling • Golf • Gymnastics • Cycling
Good Living • Defining characteristic is the enjoyment of the finer things in life • Mostly speak Afrikaans (30%) and English (23%) • Mostly females (57%) • Highest “work ethic” with 42% employed full time • Highest occurrence of married or living together (49%)
Good Living High correlation & factor scores for the following activities: • Read a newspaper with local news that’s for sale in town • Read a free newspaper delivered to home/collected from shop/taxi rank • Shop for pleasure • Read books (excluding textbooks) • Cook for pleasure • Bake for pleasure • Attend religious gathering • Use computer at work • Use computer at home • Buy lottery tickets
Gamers • Defining characteristic is that they are game enthusiasts, spending considerable time playing various computer and internet games • Mostly 25 – 34 (33%) • Mostly males (70%) • Mostly not working • Mostly single (65%)
Gamers High correlation & factor scores for the following activities: • Play computer/ playstation games • Play games via the internet • Use computer at work • Use computer at home • Use computer at home • Play board games • Visit pub/bar/shebeen/tavern
Outdoor • Defining characteristic is that they enjoy taking part in outdoor activities and are sociable • Spread across all age groups • Just under half have high school education (49%) • High unemployment (36%) • Mostly rural areas (52%) • Mid LSM range
Outdoor High correlation & factor scores for the following activities: Hire a car Photography Go to the beach Bird watch Visit pub/bar/shebeen/tavern Attend dinner parties Go to a braai • Caravanning • Visit a game reserve • Have a picnic • Camping • Go on diet • Try to loose some weight by using slimming preparations
Studious • Defining characteristic is that they focused on educational self-improvement • Youngest segment, mostly 15 – 25 (65%) • Mostly female (59%) • Mostly working full (11%) or part (4%) time • Live mainly in the Eastern Cape (21%) • Mostly speak Xhosa (24%)
Studious High correlation & factor scores for the following activities: • Attend lectures/studying part-time • Visit a library • Use newspaper educational sections • Singing • Listen to radio on cell phone • Instant chat services on cell phone • Download/listen to music on cell phone • Play games on cell phone
Traditionals • Defining characteristic is that they focused on community • Mostly older, with very few 15 – 24 year olds (12%) • Education levels are low • Mostly have Matric • Live predominantly in rural areas (54%) • Low household LSM
Traditionals High correlation & factor scores for the following activities: • Attend a funeral • Attend traditional gatherings • Attend weddings • Attend burial society meeting • Attend stockvel/syndicate/society • Grow vegetables, fruits and crops • Sing in a choir • Cook for pleasure
Homebodies • Defining characteristic is that they lead quiet lives centred on the home • Mostly female (86%) • Many divorced, widowed or separated (19%) • Bias toward rural areas (44%) • Mostly Afrikaans (17%)
Homebodies High correlation & factor scores for the following activities: • Sewing/dressmaking • Needlework/tapestry • Knitting/crochet • Scrap booking/decoupage • Bake for pleasure • Cook for pleasure • Have beauty treatments • Singing • Home decorating • DIY • Plating flowers • Sunbathing
New Visual Media • Defining characteristic is that they have a high level of computer usage • Mostly working full time (39%) • Mostly Professional & Technical (11%) or Administration & Managerial (4%) • Speak Zulu (28%), English (19%) or Afrikaans(15%)
New Visual Media High correlation & factor scores for the following activities: • Use computer at work • Use computer at home • Catch up with work after hours • Read newspapers or magazines on cell phone • Email
Showgoers • Defining characteristic is that they take pleasure in live performances • Mostly 15 – 24 years old (41%) • High unemployment (39%) • Household income is low • Zulu (35%) the most spoke language
Showgoers High correlation & factor scores for the following activities: • Opera • Pop/rock concerts • Other live concerts • Theatre • Classical music performances • Ballet • Other dance performances • Singing • Watch DVDs • Cook for pleasure • Read books • Play games on cell phone
Gardeners • Defining characteristic is that they live relatively quiet lives focusing on their gardens • Mostly 50+ years old (39%) • Mostly male (67%) • Most retired (21%) • Live in small towns and villages (14%) and rural areas (55%)
Gardeners High correlation & factor scores for the following activities: • Gardening – flowers/plants • Gardening – vegetables/crops • DIY activities