Download

1 / 36
360 likes | 522 Views
Adverse Childhood Experience in Washington. Laura Porter, DSHS ACE Partnerships March 6, 2013. Brains to Fit the Life We’ll Live. INDIVIDUAL characteristics & traits Competitive Impulsive Hyper vigilant Hyper reactive Focused – hard to shift gears OR Withdrawn Emotionally Detached

E N D
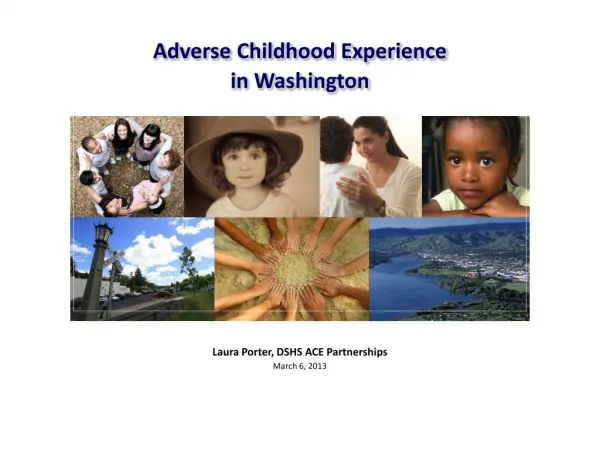
Adverse Childhood Experience in Washington Laura Porter, DSHS ACE Partnerships March 6, 2013
Brains to Fit the Life We’ll Live • INDIVIDUAL • characteristics & traits • Competitive • Impulsive • Hyper vigilant • Hyper reactive • Focused – hard to shift gears • OR • Withdrawn • Emotionally Detached • Numb WHY IT WORKS Under the worst conditions, such as war & famine, both the individual & the species survive. Toxic Context Predictable Patterns: Electrical & Chemical Functioning; Brain Mass & Gene Expression Dissonance between biological expectations & social reality fuels psychiatric disorders Neutral Start then… brains adapt to experience • INDIVIDUAL • characteristics & traits • Laid back • Relationship-oriented • Reflective • Shift focus - seize opportunity • “Process over power” WHY IT WORKS By striving for cooperative relationships, individual & species live peacefully & survive. Protective Context (c) DSHS PPA ACE Partnerships, 2013
The Neurobiology of Toxic Experience Type of Experience Gender Age – Sensitive Periods See for example: “Neurobiological and Behavioral Consequences of Exposure to Childhood Traumatic Stress” Stress in Health and Disease;Arnetz & Ekman(eds); Teicher et. al.; 2006 “Scars that Won’t Heal: The Neurobiology of Child Abuse” Scientific American; Teicher; March, 2002, pp. 68-75. “Childhood Experience and the expression of Genetic Potential: What Childhood Neglect Tells Us About Nature and Nurture”; Brain and Mind 3:79-100; Perry; 2002
Toxic Stress is Hard-Wired Into Biology Premature Birth Fetal Death Post-partum Depression Attachment Challenges Reduced Brain Mass Difficult to Sooth Stress/Hormone Dis-regulation Relationship Challenges Pre-Natal • Right-Left Brain Communication • Social Cues • Insight • Movement • Language & Math • Visual Memory/Meaning • Middle Childhood • Early Childhood • Emotional Reaction • Verbal Memory • Spatial Memory Judgment • Self Monitoring • Self Awareness • Motivation • Pre-puberty - Adolescence • Attention • Long Term Memory • Mental Health • Goal-oriented Action • Regulating movement through environment
COGNITIVE SOCIAL MENTAL HEALTH SUBSTANCE ABUSE PHYSICAL AGILITY SAFETY CHRONIC DISEASE PRODUCTIVITY STATUS Enduring Effects
Adverse Childhood Experience Study Largest Study of its Kind Over 17,000 participants Both Retrospective and Prospective Over 100 Peer-Reviewed Journal Articles Shifting the Paradigm Helps Us Understand Drivers of Population Health and Wellbeing
Adverse Childhood Experiences are Interrelated • Abuse • Child physical abuse • Child sexual abuse • Child emotional abuse • Neglect • Physical Neglect • Emotional Neglect • Indicators of Family Dysfunction • Mentally ill, depressed or suicidal person in the home • Drug addicted or alcoholic family member • Parental discord – indicated by divorce, separation, abandonment • Witnessing domestic violence against the mother • Incarceration of any family member ACEs Have Cumulative Effect: ACE Score = Number of Categories of ACEs (1-10)
ACEs are Common Among Washington Adults 62% have at least one ACE category 26% have ≥ three 5% have ≥ six
Dose-Response Relationship Higher ACE Score Reliably Predicts Prevalence of Health Problems The size of the “dose”— the number of ACE categories Drives the “response”— the occurrence of health, social, workforce problems & early death Response gets bigger Higher ACE Score
A Significant Portion Of Risk for Disease Is Attributable to ACEs… Smoking Heavy Drinking Binge Drinking Drinking and Driving Had a Drug Problem Addicted to Drugs Ever Injected Drugs Original ACE Study (c) DSHS PPA ACE Partnerships, 2013
A Large Portion of Mental Illness Is Attributable to ACEs… Depression Serious and persistent mental illness Frequent mental distress Nervousness Suicide attempts Emotional problems that restrict activities (c) DSHS PPA ACE Partnerships, 2013
A Large Portion of Mental Illness Is Attributable to ACEs… Depression Serious and persistent mental illness Frequent mental distress Nervousness Suicide attempts Emotional problems that restrict activities
A Significant Portion of Disability & Disability-Related Barriers to Employment Is Attributable to ACEs… Some ACE-Attributable Disabilities are Invisible ADHD Anxiety Disorders Asthma Bipolar Disorder Chronic Pain Sleep disorders Depression Diabetes Hypoglycemia Major Depression Metabolic Syndrome Personality Disorders Primary Immunodeficiency Psychiatric disabilities Arthritis Schizophrenia Missing Work Due to Disability (c) DSHS PPA ACE Partnerships, 2013
ACEs and Ability to Engage in Work/Life Activities Attributable to ACEs: Disability-Related Days when Can’t Do Usual Activities Worker Injury Work-related Illness Drugs/Alcohol Hopelessness Health Limits Activity Serious Job Problems Serious Financial Problems 29.7% of the Working Age Population (Age 18-64) has 3 or more ACEs
In the average Washington classroom: • 6 students have no ACE • 5 students have 1 ACEs • 6 students have 2 ACEs • 3 students have 3 ACEs • 7 students have 4-5 ACEs • 3 students have 6+ ACEs Knowing the prevalence of ACEs and how they affect brain development, it’s clear to see why so many students struggle to focus in an academic environment. ACEs in WA High Schools Graphic by Northwest Children’s Fund, 2012
WA Data Shows Cascade of Experiences …Societal Response Matters ACE Transmission Risk
Adult Adversity Incarceration Victim of Intimate Partner Violence Drug/Alcohol Mental Illness Divorce In Washington…. Parenting Adults with ≥5 ACE 14 TIMES more likely to have two or more conditions that make ACEs for kids Court-Involved Youth Higher ACE Scores Among those with ≥4: 51% special ed. (vs. 33% 0-1) 74% below 2.0 GPA (58%) 85% suspended by 2nd(71%) 33% re-offend in 2 years (13%) High School Youth 42% ≥ 3 ACEs Work injury- illness Homelessness Disability Poverty Health limits activity Unemployment Elementary Children 12% ≥ 3 ACEs 1. Health, attendance, behavior 2. Academic failure
“Understanding Adverse Childhood Experiences can open doors for the future you would like for yourself and for future generations.” Dr. Ronald Voorhees, MD, PhD Chief Office of Epidemiology & Biostatistics Allegheny County Health Department
Three Systems For Promoting Resilience • Community, Culture, Spirituality • Bonds with parents and/or caregivers • Positive relationships with competent and nurturing adults • Friends or romantic partners who provide a sense of security & belonging, help with emotion coaching • Faith, hope, sense of meaning • Engagement with effective orgs – schools, work, pro-social groups • Network of supports/services & opportunity to help others • Cultures providing positive standards, expectations, rituals, relationships & supports • Attachment & Belonging • Intellectual & employable skills • Self regulation – self control, executive function, flexible thinking • Ability to direct & control attention, emotion, behavior • Positive self view, efficacy • Capability (c) DSHS PPA ACE Partnerships, 2013 Resilience definition: Iris HeavyRunner
KEY COMPONENTS OF Resilience as a DEVELOPMENTAL PROCESS • Community, Culture, Spirituality Washington Measures Resilience Index: Hope, Positive View, Social/Emotional Support Capacity Building Process: Opportunities for Everyone to Help Coming Together – See the Truth Clearly Learning Together – Reciprocity Results-Based Decisions – Desired Future • Attachment & Belonging • Capability
High-Leverage Solutions Moderate ACE Effects Among Parenting Adults: Build on Strengths; Improve Functioning & Coping Prevent ACE accumulation in next generation 8 1 Fewer ACE effects Virtuous Cycle
Community Variation In Some King County Communities… 41% of Parenting Adults have an ACE Score of ≥ 3 In Other Communities… 6% of Parenting Adults have an ACE Score of ≥ 3 (Washington State Prevalence among all adults is just over 26%) Preliminary Analysis, BRFSS Data 2009-2011
ACEs Are… Not The Whole Story Some Communities with High ACE Prevalence Also Have High Levels of Social/Emotional Support
Social/Emotional Support as a resilience factor Rarely/Never Receive Support Sometimes Receive Support Always/Usually Have Support
Support, Positive View & Hope Improve Housing Stability Moved ≥ 4 Times in Past Year
Unemployment: ACEs by Resilience % Unemployed High Resilience Low Resilience Resilience Measures: Social/Emotional Support, Positive View, Hope
Resilience Occurs at All Levels The natural human capacity to navigate life well. (HeavyRunner & Marshall, 2003) Community
Efficacious Community What Helps? Opportunities for Everyone to Help – to Co-Lead Coming Together – Focus on Matters of Importance Learning Together – Reciprocity Results-Based Decisions – Acting from Desired Future
The Power of community capacity Less DEPRESSION & SERIOUS PERSISTENT MENTAL ILLNESS Ages 18-34 Ages 18 – 34 with 3-8 ACEs High Capacity High Capacity High Capacity Severe Depression Significant differences after controlling for age, education, income, race/ethnicity, and ACE score.
Reduced Prevalence of High ACE Scores Among 18-34 Year Olds In Communities using Community Capacity Development (CCD) Model Percent with ≥3 ACEs Source: Strength, Stress, Work, Hope; Technical Appendix, in press; Washington Family Policy Council; 2012
ACE Reduction Reliably Predicts Improved Health Well-being Productivity Population Attributable Risk for ACE–related problems ranges from 20% to 70%
“For every ACE that we can prevent or mitigate… We are improving a child’s chances for a healthy future.” NW Children’s Fund Annual Report, 2012