Download

1 / 49
490 likes | 652 Views
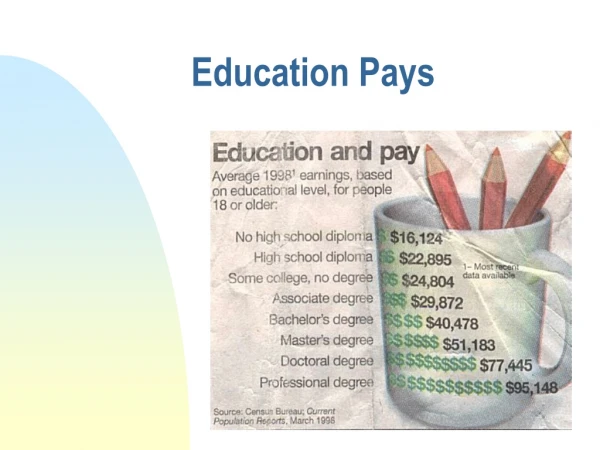
Education Pays 2007. Median Earnings and Tax Payments of Full-Time Year-Round Workers Ages 25 and Older, by Education Level, 2005. Notes: Taxes paid include federal income, Social Security, and Medicare taxes, and state and local income, sales, and property taxes.

E N D
Median Earnings and Tax Payments of Full-Time Year-Round Workers Ages 25 and Older, by Education Level, 2005 Notes: Taxes paid include federal income, Social Security, and Medicare taxes, and state and local income, sales, and property taxes. Sources: U.S. Census Bureau, 2006, PINC-03; Internal Revenue Service, 2006; McIntyre et al., 2003; calculations by the authors.
Expected Lifetime Earnings Relative to High School Graduate, by Education Level Notes: Based on the sum of median 2005 earnings from ages 25 to 64 for each education level. Future earnings are discounted using a 3 percent annual rate to account for the reality that, because of foregone interest, dollars received in the future are not worth as much as those received today. Sources: U.S. Census Bureau, 2006, PINC-03; calculations by the authors.
Estimated Cumulative Earnings Net of Loan Repayment for Tuition and Fees, by Education Level Note:Based on median 2005 earnings for each education level at each age and discounted using a 3 percent annual rate. Earnings for bachelor’s degree recipients include only those with no advanced degree. Assumes tuition and fees are financed with borrowing, and loan payments are made for 10 years after graduation. Sources:U.S. Census Bureau, 2006, PINC-03, PINC-04; The College Board, 2005; calculations by the authors.
Median Earnings of Full-Time Year-Round Workers Ages 25–34, by Race/Ethnicity, Gender, and Education Level, 2005 Note:Sample sizes for Asian females as well as Asian males with less than a high school diploma and associate degrees are too small to allow reliable reporting. Sources:U.S. Census Bureau, 2006, PINC-03.
Median, 25th Percentile, and 75th Percentile Earnings of Full-Time Year-Round Workers Ages 25 and Older, by Gender and Education Level, 2005 Sources:U.S. Census Bureau, 2006, PINC-03; calculations by the authors.
Median Earnings of Full-Time Year-Round Workers Ages 25-34, by Gender and Education Level, 1971–2005 (in Constant 2005 Dollars) Sources: National Center for Education Statistics (NCES), 2007, Indicator 20 (based on U.S. Census Bureau, Current Population Survey); calculations by the authors.
Percentage of Full-Time Year-Round Workers Ages 25 and Older Who Were Offered Employer-Provided Pension Plans, by Education Level, 2005 Sources: U.S. Census Bureau, Current Population Survey, 2006 Annual Social and Economic Supplement; calculations by the authors.
Percentage of Eligible Full-Time Year-Round Workers Ages 25 and Older Who Participated in Employer-Provided Pension Plans, by Education Level, 2005 Sources: U.S. Census Bureau, Current Population Survey, 2006 Annual Social and Economic Supplement; calculations by the authors.
Percentage of Private-Sector Workers Ages 18–64 Working at Least Half-Time Covered by Employer-Provided Health Insurance, by Education Level, 1979–2005 Sources:Mishel et al., 2007, Table 3.12.
The Impact of Increases in the Proportion of College Graduates in the Workforce on Wagesof All Workers, by Education Level Sources:Moretti, 2004; calculations by the authors.
Unemployment Rates of Individuals Ages 25 and Older, by Race/Ethnicity and Education Level, 2006 Sources:Bureau of Labor Statistics, 2007, Table 7 (based on U.S. Census Bureau, Current Population Survey).
Percentage of Individuals Ages 25 and Older Living in Households in Poverty, by Household Type and Education Level, 2005 Sources:U.S. Census Bureau, Current Population Survey, 2006 Annual Social and Economic Supplement; calculations by the authors.
Percentage of Individuals Ages 25 and Older Living in Households That Participated in Public Assistance Programs, by Education Level, 2005 Sources: U.S. Census Bureau, Current Population Survey, 2006 Annual Social and Economic Supplement; calculations by the authors.
Percentage of Individuals Ages 25 and Older Reporting Excellent or Very Good Health, by Income and Education Level, 2005 Sources: National Center for Health Statistics (NCHS), 2005 National Health Interview Survey; calculations by the authors.
Percentage of Individuals Ages 25 and Older Reporting Excellent or Very Good Health, by Age and Education Level, 2005 Sources: National Center for Health Statistics (NCHS), 2005 National Health Interview Survey; calculations by the authors.
Smoking Rates of Individuals Ages 25 and Older, by Education Level, 1940–2005 Notes: Data for 2001-05 are three-year moving averages (i.e., the average of the current year and the two previous years). Sources: De Walque, 2004; NCHS, National Health Interview Survey, various years.
Distribution of Smoking Histories Among Individuals Ages 25 and Older, by Education Level, 2005 Notes: Percentages may not add up to 100 due to rounding. Sources:NCHS, 2005 National Health Interview Survey; calculations by the authors.
Percentage of Individuals Ages 25 and Older Reporting Vigorous or Light/Moderate Activity, by Education Level, 2005 Sources: NCHS, 2005 National Health Interview Survey; calculations by the authors.
Cognitive Skills of Preschool Children Ages 3–5, by Mother’s Education Level, 2005 Sources: U.S. Census Bureau, 2007, Table 224 (based on 2005 National Household Education Survey).
Percentage of Students in Kindergarten Through Eighth Grade Who Participated in After-School Activities, by Parents’ Highest Education Level, 2005 Sources: NCES, After-School Programs and Activities Survey of the 2005 National Household Education Survey.
Percentage of Individuals Ages 25 and Older Who Donated Blood in the Past 12 Months, by Education Level, 2005 Sources: NCHS, 2005 National Health Interview Survey, calculations by the authors.
Percentage of Individuals Ages 25 and Older Who Volunteered and the Median Number of Hours Volunteered, by Education Level, 2006 Source: Bureau of Labor Statistics, 2007, Table 1.
Percentage of U.S. Citizens Ages 25 and Older Who Voted, by Age and Education Level, 2004 Source: U.S. Census Bureau, 2004, Table 5.
Importance Placed by Individuals Ages 25 and Older on Trying to Understand Opinions of Others, by Education Level, 2005 Sources: National Opinion Research Center, General Social Survey, 2004 Citizenship Module; calculations by the authors.
Postsecondary Enrollment Rates of Recent High School Graduates by Family Income, 1983–2005 Notes: Based on enrollment in college within 12 months of high school graduation. Income quintiles are defined in terms of all households. In 2005, the upper income limits of the quintiles were: lowest, $16,799; 2nd, $31,998; 3rd, $50,380; and 4th, $80,662. High school graduates are not evenly distributed among income quintiles. In 2005, 13 percent of high school graduates were in the lowest income quintile, 15 percent were in the 2nd, 16 percent were in the 3rd, 24 percent were in the 4th, and 31 percent were in the highest income quintile. Sources: NCES, unpublished tabulation using data from the Current Population Survey.
Postsecondary Enrollment Rates of Recent High School Graduates by Race/Ethnicity, 1973–2005 Note: Postsecondary enrollment includes both undergraduate and graduate students. Sources: Snyder et al., 2006, Table 181 and Table 184; U.S. Census Bureau, 2005, Table 1; calculations by the authors.
Postsecondary Enrollment Rates of High School Graduates Ages 18–24 by Race/Ethnicity, 1973–2005 Note: Postsecondary enrollment includes both undergraduate and graduate students. Sources: Snyder et al., 2006, Table 181 and Table 184; U.S. Census Bureau, 2005, Table 1; calculations by the authors.
Postsecondary Enrollment Rates of Recent High School Graduates by Gender, 1967–2005 Note: Postsecondary enrollment includes both undergraduate and graduate students. Sources: Snyder et al., 2006, Table 182 and Table 184; U.S. Census Bureau, 2005, Table 1; calculations by the authors.
Postsecondary Enrollment Rates of High School Graduates Ages 18–24 by Gender, 1967–2005 Note: Postsecondary enrollment includes both undergraduate and graduate students. Sources: Snyder et al., 2006, Table 182 and Table 184; U.S. Census Bureau, 2005, Table 1; calculations by the authors.
Postsecondary Enrollment Rates of Individuals Ages 18–34 by Age, 1970–2005 Note: Includes part-time and full-time enrollment in postsecondary institutions with programs of at least two years. Source: NCES, 2007, Indicator 1.
Family Income Distribution of Dependent Students Within Postsecondary Sectors, 2003-04 Notes: The “Other” category in Figure 2.5b includes students who were enrolled in public less-than-two-year institutions, private not-for-profit less-than-four-year institutions, and those who were enrolled in more than one institution. Percentages may not add up to 100 due to rounding. Source: Horn et al., 2006, Table 1.3 and Table 3.5A.
Dependent Students’ Choice of Postsecondary Sector by Family Income, 2003-04 Notes: The “Other” category includes students who were enrolled in public less-than-two-year institutions, private not-for-profit less-than-four-year institutions, and those who were enrolled in more than one institution. Percentages may not add up to 100 due to rounding. Source: Horn et al., 2006, Table 1.3 and Table 3.5A.
Education Level in 2000, by Math Test Scores and Socioeconomic Status in High School, High School Class of 1992 Notes: Socioeconomic status (SES) was measured by a composite score based on parental education, occupations, and family income. Middle SES and middle math scores include middle two quartiles. Percentages may not add up to 100 due to rounding. Source: Fox, et al., 2005, Table 21.
Percentage of Full-Time First-Year Dependent Students at Four-Year Institutions in 1995 Who Had Completed Bachelor’s Degrees by 2001, by Family Income, Parent Education Level, and Test Scores Notes: Includes first-year dependent students who were enrolled full-time at a public four-year or private not-for-profit four-year institution during the first term of the 1995-96 school year. Sample size for highest SAT quartile students with family income of $70,000 and over, neither of whose parents has a bachelor’s degree is too small to allow reliable reporting. The SAT score is a combined score derived as either the sum of SAT verbal and math scores or the ACT composite score converted to an estimated SAT score. Sources: NCES, Beginning Postsecondary Students Longitudinal Study: 1996/2001; calculations by the authors.
Percentage of Full-Time First-Year Dependent Students at Four-Year Institutions in 1995 Who Had Completed Bachelor’s Degrees by 2001, by Family Income, Parent Education Level, and Test Scores Notes: Includes first-year dependent students who were enrolled full-time at a public four-year or private not-for-profit four-year institution during the first term of the 1995-96 school year. Sample size for highest SAT quartile students with family income of $70,000 and over, neither of whose parents has a bachelor’s degree is too small to allow reliable reporting. The SAT score is a combined score derived as either the sum of SAT verbal and math scores or the ACT composite score converted to an estimated SAT score. Sources: NCES, Beginning Postsecondary Students Longitudinal Study: 1996/2001; calculations by the authors.
Percentage of Full-Time First-Year Dependent Students at Four-Year Institutions in 1995 Who Had Completed Bachelor’s Degrees by 2001, by Race/Ethnicity and Family Income Notes: Includes first-year dependent students who were enrolled full-time at a public four-year or private not-for-profit four-year institution during the first term of the 1995-96 school year. The SAT score is a combined score derived as either the sum of SAT verbal and math scores or the ACT composite score converted to an estimated SAT score. Sources: NCES, Beginning Postsecondary Students Longitudinal Study: 1996/2001; calculations by the authors.
Percentage of Full-Time First-Year Dependent Students in Four-Year Institutions in 1995 Who Had Completed Bachelor’s Degrees by 2001, by Race/Ethnicity and Parent Education Level Notes: Includes first-year dependent students who were enrolled full-time at a public four-year or private not-for-profit four-year institution during the first term of the 1995-96 school year. The SAT score is a combined score derived as either the sum of SAT verbal and math scores or the ACT composite score converted to an estimated SAT score. Sources: NCES, Beginning Postsecondary Students Longitudinal Study: 1996/2001; calculations by the authors.
Education Level of Individuals Ages 25 and Older, 1940–2006 Note: Percentages may not add up to 100 due to rounding. Source: U.S. Census Bureau, 2006a, Table A-1.
Percentage of Individuals Ages 25–29 Who Have Completed High School, Some College, and College, by Race/Ethnicity and Gender, 1971–2006 Source: NCES, 2007, Indicator 27.
Percentage of Individuals Ages 25–29 Who Have Completed High School, Some College, and College, by Race/Ethnicity and Gender, 1971–2006 Source: NCES, 2007, Indicator 27.
Percentage of Individuals Ages 25–29 Who Have Completed High School, Some College, and College, by Race/Ethnicity and Gender, 1971–2006 Source: NCES, 2007, Indicator 27.
Education Level of Individuals Ages 25 and Older, by Metropolitan/Nonmetropolitan Residence and Race/Ethnicity, 2006 Notes: The term “metropolitan” refers to all counties in Metropolitan Statistical Areas (MSAs) and the term “nonmetropolitan” refers to all counties outside MSAs. The underlying concept of an MSA is that of a core area containing a large population nucleus, together with adjacent communities having a high degree of economic and social integration with that core. Percentages may not add up to 100 due to rounding. Source: U.S. Census Bureau, 2006a, Table 11.
Postsecondary Enrollment Rates of Recent High School Graduates by Type of Postsecondary Institution and Selected High School Characteristics, 1999–2000 Note: Enrollment rates are the percentages of 1999 high school graduates who were enrolled in a postsecondary institution in the 1999–2000 school year. Source: Snyder et al., 2006, Table 183.
Percentage of Individuals Age 24 with First University Degrees in Science and Engineering and Other Fields, by Selected Region and Country/Economy, 2002 or Most Recent Year Source: National Science Foundation (NSF), 2006, Appendix Table 2-37.
Academic Achievement Levels of Students Age 15, by Selected Country/Economy, 2003 Notes: Hong Kong is not an Organisation for Economic Co-operation and Development (OECD) country/region. Percentages may not add up to 100 due to rounding. Source: OECD, 2003.
Academic Achievement Levels of Students Age 15, by Selected Country/Economy, 2003 Notes: Hong Kong is not an Organisation for Economic Co-operation and Development (OECD) country/region. Percentages may not add up to 100 due to rounding. Source: OECD, 2003.
Academic Achievement Levels of Students Age 15, by Selected Country/Economy, 2003 Notes: Hong Kong is not an Organisation for Economic Co-operation and Development (OECD) country/region. Percentages may not add up to 100 due to rounding. Source: OECD, 2003.