
Enhancing Understanding of Lake Superior Streams
Presenting real-time data on stormwater and stream quality in northeastern MN to engage citizens, students, and agencies. Featuring data visualization tools and interactive content to promote environmental awareness. Collaborative effort by experts in the field.

Enhancing Understanding of Lake Superior Streams
E N D
Presentation Transcript
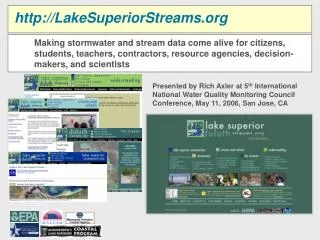
http://LakeSuperiorStreams.org Making stormwater and stream data come alive for citizens, students, teachers, contractors, resource agencies, decision-makers, and scientists Presented by Rich Axler at 5th International National Water Quality Monitoring Council Conference, May 11, 2006, San Jose, CA
DuluthStreams.org LakeSuperiorStreams.org Rich Axler George Host Jane Reed Jerry Henneck Elaine Ruzycki Gerry Sjerven David Lonsdale Cindy Hagley Jesse Schomberg Bruce Munson Carl Richards Nick Zlonis Marnie Lonsdale Todd Carlson Jerry Walker Al Odean Nate Meyer Cooperators Jesse Anderson Mindy Granley Partners
Northeastern Minnesota waters A very sensitive region • >5000 high quality lakes • thin, nutrient-poor soils • high gradient, high-DO, cold and “clear” water streams • Lake Superior A PROTECTION MESSAGE IN A RESTORATION WORLD
Surface and stormwater quality As in many urban areas, northeastern MN streams face environmental threats related to stormwater
DuluthStreams “Rationale” • Duluth alone has 42 named streams • High density for size of urban area
Enhance public understanding of aquatic ecosystems and their connections to watershed land use Focus on Economic and environmental sustainability People actions The “easy” part: Data collected and on the Web Data visualization tools Explanatory materials The hard part: Making the data understandable and interesting for everyone! General public Students and teachers Contractors and consultants Decision makers Agencies Scientists Mission … using near real-time data
More specific original objectives: • Install real-time remote WQ sensors in Tischer, Chester, Kingsbury, Amity Creeks and the St. Louis R. • Deliver information using advanced data visualization tools over the Internet and at public kiosks (Great Lakes Aquarium and Duluth Zoo) • Link data for 12 trout streams with GIS technology to current and historical WQ and biological databases • Incorporate visually engaging interpretive text, animations and videos into the website to illustrate the nature and consequences of degraded stormwater and real costs to society
Automated stream sampling • Instruments log data every 15 minutes for daily delivery to web-site and data visualization tools • Flow, temperature, specific conductivity (EC25), turbidity
Poplar River St. Louis River
Ontario, Canada Lake Superior (Western Arm) Future sites: Wish list – MPCA long-term sites + Impairments (TMDLs), Parks (pristine ?), multiple sites in more urbanized streams Duluth,MN
Data visualization and animation tools: September - October 2005 gully washers
Mapping turbidity Mapping flow Rain on top of snow – Poplar River April 2006 (turbidity TMDL)
Examples of other data “vignettes” • Increased turbidity from high runoff and erosion • Flashy stream flow surges and Inflow and Infiltration (I & I) events causing sewage overflows and spills • Temperature “spikes” from rain water running across hot roads and parking lots • Short-term (hours) increases in salt concentration during early winter snowfalls from de-icers • Longer-term (weeks) increases in salt and turbidity levels during early stages of spring runoff • Seiche effects between Lake Superior and the St. Louis River Estuary (Duluth-Superior Harbor)
Look for increased rain , muddy brown water and WLSSD discharge When it rains hard in Duluth… July 2003 Stream flashiness Flow and turbidity (sediment) Sewage plant flashinessInflow & Infiltration (I&I)
July 7, 2003 – 1- 2 “ rain Plant running @ 140 mgd When it rains hard in Duluth 2003… July 6, 2003 - cloudy Plant running @ 25-40 mgd Eight overflows in WLSSD’s collection system released roughly one million gallons of untreated sewage.
A lot happens from all this “extra” water • About 5.8 mgd in sewage overflows • Elevated coliform bacteria (health risks) • Pollutant loads to Lake Superior
LakeSuperiorStreams and the new Lake Superior Beach Monitoring Program FOR IMMEDIATE RELEASE: August 5, 2003 Teachable Moment!! FOUR WATERFRONT AREAS OFF-LIMITS
Tischer Chester Kingsbury Chronic toxicity to brook trout Stream data visualization tool: Salt loading, October, 2002 Higher salt level = higher electrical conductivity (Look for darker blue to magenta changes)
= chronic toxicity to brook trout Spring runoff 2004 – 3 weeks of salt exceeding chronic adult brook trout criterion
The warmest January in >150 yrs The main snowmelt in early March Winter-Spring 2006 …
Middle of the night spikes of 3-6oC from stormwater road/lot runoff Stream temperature is a major stressor of Duluth trout. See how roads and lots warm the water by >5 oF Lesson – even moderate rain can cause a 5-11 oF jump as water moves across warm asphalt. Trout in more developed watersheds are already near the upper range of their temperature tolerance in the summer.
Brook trout stress • 15 days continuously over the optimal temperature range for brook trout; exceeding upper limit 10 times
New bacteria dataviewer and map utilitywww.lakesuperiorstreams.org/bacteriawww.mnbeaches.org
Other DuluthStreams Data – Check out the GIS-IMS Utility Tischer Creek Washburn Edison School You can zoom in and overlay streams, roads, land uses, etc.
Stream data “library” index • Map location • Real-time data • Manual + chemistry data • Storm data • Land use data • Photos • Historical photos • GIS Map utility • Reports (links + pdfs)
School Curricula and Volunteer Monitoring The frequent student “grab” sample data told a very similar story for muddiness and salting– Volunteers can really help!!! - Next step is to build in a QAPP • Establish event-based monitoring of transparency and EC25 by regional schools • Follow MPCA-CSMP protocols to assess Impairment • Link to River Watch biological indices (e.g., St. LouisRiver Watch
Stormwater: Site Design Toolkit, RSPT, permits… Focus: Low impact and conservation designs, regional case studies and contractor training
Regional Stormwater Protection Team • Coordinated educational programs and technical assistance • Entities involved include both Minnesota and Wisconsin MS4s, education/outreach, agencies • Organizations involved (21): • City • County • MNDOT • Township • Tribal • State agency • SWCDs • University • Nonprofits • Wastewater treatment facilities
To generate annual loads for comparison with event-based grab sample estimates Further data analysis in progress to link sensor data with other parameters • Turbidity appears to correlate well with: • TSS • Total - P • Total - Hg • Specific conductivity correlates with: • • TDS • Cl - (Not shown)
Clean hands, dirty hands Hg: 2005-06 Turbidity appears to also correlate well with Total – Hgand so provides a way to estimate seasonal Hg loads from Duluth and Northshore Streams
280,000 12/05 56,000 3/02 2003 2004 2005 Website page requests/month (Aug 2005) Seasonal peaks probably related to student and teacher use Activity closely linked to our WaterontheWeb.org on-line Water Science Curriculum that is generating ~ 1.5 M “hits”/month
Science based: Linking text book information to data to reality to what can you do to help fix it
Summary • Flow, temperature, electrical conductivity, turbidity can tell us a lot about water quality and habitat condition • We need data during storm events to really understand impacts to streams and their health • Data can help provide the link between people’s actions in the watershed and the condition of our water resources • Partnerships between scientists, teachers, agencies, NGOs, and the private sector are essential • Please take time to explore lakesuperiorstreams.org
Lake Superior Streams: Focus on education and data Poster children for controlling pet wastes
Look for increased rain , muddy brown water and WLSSD discharge When it rains hard in Duluth… July 2003 Stream flashiness Flow and turbidity (sediment) Sewage plant flashinessInflow & Infiltration (I&I)
