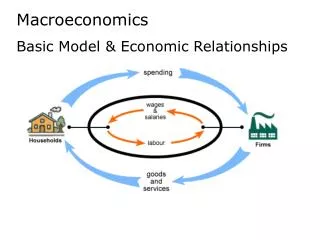
Basic Macroeconomics Parameters
Basic Macroeconomics Parameters. Prešov. Košice. Žilina. Banská Bystrica. Bratislava. Trenčín. Nitra. Trnava. Slovenská Republika / Slovak Republic. Location: Central Europe Inhabitants: 5.382.178 Capital: Bratislava

Basic Macroeconomics Parameters
E N D
Presentation Transcript
Prešov Košice Žilina Banská Bystrica Bratislava Trenčín Nitra Trnava SlovenskáRepublika / Slovak Republic • Location: Central Europe • Inhabitants: 5.382.178 • Capital: Bratislava • Nationalities: Slovak 85,7%, Hungarian 9,6%, Roma 1,8%, Czech 0,9%, others 2,0% • Religion: Catholic 69% • Time zone: GMT + 1 hour • Member of: EU, NATO, OSN, OECD, WTO • Currency:EUR since 1/1/2009 • Exchange rate:1 EUR = 30,126 SKK (conversion rate – 1/1/2009) Source: Statistical Yearbook of SR
GDP development Source: FPI
GDP development Source: FPI
Nominal wage development Source: FPI
Unemployment and inflation Source: FPI
Consumer confidence index CCIis a measure of consumer optimism toward current economic conditions It is the arithmetic average of the responses to the questions on expected developments over the next 12 months in the financial situation of households, the general economic situation, unemployment and savings. Closely watched because many economists consider consumer optimism an important indicator of the future health of the economy. Source: Eurostat; definiton: ECB
Household income/consumption Source: FPI
4Cs life-style segmentation • Cross cultural consumers characteristics (4Cs) • is segmentation tool that • devides people according to their life values • into7 psychographic types. • Unlike demography 4Cs helps to understand • motivations behind brand • preferences that are created in people´s minds. Source: MML/TGI;4Cs
Net advertising expenditures Source: Group M estimation
Seasonality of ad expenditures Source: Ad spend - GroupM Slovakia estimate, Seasonality - A-connect (monitored pricelist cost)
Ad expenditures by industry Source: TNS A-connect
Top 20 advertisers 1 2 5 4 10 15 14 3 16 8 12 11 9 7 13 31 TOP 20 advertisers in 1QY2011 invested a sum of€61 mil. that represents36% share from all ad expendituresin all media (37% in 1QY2010) 6 32 39 Source: TNS A-connect
Top 20 advertisers Source: TNS A-connect
What is new • Recent development • Markíza is a long-term leader keeping its position via attracting of Jednotka viewers • JOJ in 2010 continuously strengthening its position - particularly strong in prime time (27% SOM in PT) • However, recently TV Markiza, launched succesfull formats (1000 a 1 noc, CS Superstar 2) that helped regain some share • SOM on AA12-54 is app.MA/JOJ 36/20 • Market expectations for 2011: • major TV shows battle will continue (Freemantle on JOJ; with exception of SHS kept by Markíza) • Slight growth of ad spends expected (up to 5%) • Competitive market environment should keep inflation low (3-3,5%) • Increasing importance of secondary channels (higher investment in programming = bigger portion of ad spends) • Other market news • STV foundations are to be shaken - merging operation with public radio announced by Ministry of Culture • Advertising limitation by law on STV (decrease by 0,5% to 1% of broadcasting time in 2011) • Possible launch of other secondary channels (sport, movie focus) expected mainly by CME Source: FPI
Net advertising expenditures Source: GroupM Estimation
GRPs development Source: TNS PMT
GRPs share development Source: TNS PMT
Top 20 advertisers 22 22 21 22 1 22 11 3 22 22 21 2 22 22 11 6 22 22 21 8 22 22 11 7 22 22 21 4 22 22 11 16 22 22 21 5 22 22 11 22 9 22 21 17 22 22 11 12 22 22 21 14 22 22 11 23 22 22 11 13 22 22 21 11 TOP 20 advertisers in 1QY2011 invested a sum of282,073 GRP 30s that represents49% sharefromall GRPs in TV media (56% in 1QY2010) 22 22 11 35 22 22 11 15 48 22 22 21 22 22 11 Source: TNS PMT
Top 20 advertisers Source: TNS PMT
Development of TV market share 2009 2010 ´11 Source: TNS PMT
Ups & Downs – 1QY 2011 JOJ Ups Average rating: 0,6 Averageshare: 13,1 Dr. Ludský Average rating: 7,5 Averageshare: 26,3 Panelák Average rating: 7,6 Averageshare: 21,3 Keby bolo keby 2 Average rating: 6,5 Averageshare: 23,8 Šéfka Average rating: 6,0 Averageshare: 19,2 Tajný sen Chutíš mi Tisíc a jedna noc Averagerating: 16,1 Averageshare: 45,2 Česko Slovenská SuperStar 2 Average rating: 16,4 Averageshare: 46,4 Partička Averagerating: 6,6 Averageshare: 36,7 STV Average rating: 0,5 Averageshare: 4,0 Data I-II/2011 Average rating: 2,6 Averageshare: 17,2 JOJ Downs Markíza Ups Downsother
Daily/ Weekly Reach Source: TNS PMT
All day Prime time Usage of advertising space Markíza/DOMA Input for calculation comes from advertising space allowed per day: Public stations: max. 1% of daily broadcasting; Commercial stations: max. 15% of daily broadcasting Source: TNS PMT
All day Prime time Usage of advertising space JOJ / JOJ Plus Input for calculation comes from advertising space allowed per day: Public stations: max. 1, of daily broadcasting; Commercial stations: max. 15% of daily broadcasting Source: TNS PMT
All day Prime time Usage of advertising space Jednotka / Dvojka Input for calculation comes from advertising space allowed per day: Public stations: max. 1% of daily broadcasting; Commercial stations: max. 15% of daily broadcasting Source: TNS PMT
Development of daily ad exposure Source: TNS PMT
Development of weekly ad exposure Source: TNS PMT
Av. no. of on-line streams per month Markiza might be the no. one TV in the offline world, however this is not true on the internet. Joj.sk triumphs thanks to a combination of user-frienly interface and attractive content, based on original TV series. Source: publishers, February 2011
What is new? • Current market situation • 1QY 2011: ad spend seem to be stabilised after two years of significant ad spend decrease in previous two years • Deflation of Net/Net ad price continues • Also print consumption is stabilised after previous years fall • Ringier • License for publishing of Geo magazine acquired (published from Oct.) • Spoločnosť 7 Plus • New division of titles for kids (Zornička, Superohník, Včielka, Bobík) • Perex (daily Pravda) • Change of top management under the new owner Florena (client of J&T) and again change of CEO recently • Pravda is trying to come back to news title format • Ecopress • Acquisition of Sanoma magazines publisher house
Net advertising expenditures Source: GroupM Estimation
Share of expenditures (SOS) by print type Source: A-Connect
Top 20 advertisers 22 22 21 22 22 11 3 22 1 22 21 2 22 22 11 4 22 22 21 5 22 22 11 8 22 22 21 7 22 22 11 9 22 22 21 15 22 22 13 11 22 20 22 21 11 22 22 11 27 22 22 21 10 22 22 11 83 22 22 11 62 22 22 21 36 TOP 20 advertisers in 1QY2011 invested a sumof38,635,051€thatrepresents30% sharefromall ad expenditures in printmedia 22 22 11 21 22 22 11 68 22 22 21 12 22 22 11 Source: A-connect
Top 20 advertisers Source: A-connect
Dailies – read last issue (%) Source: MML TGI
Weeklies- read last issue (%) Source: MML TGI
Supplements- read last issue (%) Source: MML TGI
Monthlies- read last issue (%) Source: MML TGI
Audited circulation – sold issues Average sold issues as in the given MML period: MML 4/2009 MML 3/2010 MML 4/2010 Avg. daily read by 6,4 people Avg. monthly read by 3,6 people Avg. weekly read by 3,0 people Source: ABC
Online vs- offline readership Source: MML TGI, AIM
What is new? • Channels are keeping stable market position • Morning show is becoming more and more popular format among all radio channels • Current market situation • Crisis suits to radio as it is a cheap and typical „promotion media“ – recorded much lower decrease comparing ad market average • Stable situation on radio market concerning ad spends and ad price also in 2011 • Jemné melódie • Change of programming structure (less music, more words) and more family radio positioning (instead of female positioning) • But still keeping Soft AC music format • Slovenskýrozhlas • Mergedwith Slovak TV into RTVS • So far no major changes planned Source: FPI
Advertising expenditures development Source: A-connect
Development of radio market share Source: MML TGI
Top 20 advertisers 2 1 6 14 3 4 10 9 12 106 5 7 24 8 20 27 TOP 20 advertisers in 1QY 2011 invested a sum of15,651,347€ that represents36% share from all ad expenditures in printmedia (28% in 1QY 2010) 21 119 23 Source: A-connect
Top 20 advertisers Source: A-connect