High Sensitivity EPMA: Past, Present and Future
340 likes | 525 Views
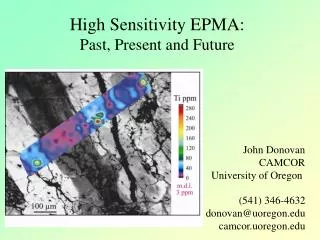
High Sensitivity EPMA: Past, Present and Future. John Donovan CAMCOR University of Oregon. (541) 346-4632 donovan@uoregon.edu camcor.uoregon.edu. The Past: EPMA/SEM (from Goldstein, et. al. 1988) :. Comparison of EDS to WDS, Equal Beam Current, pure Si and Fe, 10 -11 A (0.01 nA), 25 keV.

High Sensitivity EPMA: Past, Present and Future
E N D
Presentation Transcript
High Sensitivity EPMA:Past, Present and Future John Donovan CAMCOR University of Oregon (541) 346-4632 donovan@uoregon.edu camcor.uoregon.edu
The Past: EPMA/SEM (from Goldstein, et. al. 1988): Comparison of EDS to WDS, Equal Beam Current, pure Si and Fe, 10-11 A (0.01 nA), 25 keV Comparison of EDS to WDS, Optimized Conditions, 15 keV, 180 seconds counting time: EDS : 2 x 10⁻⁹ A (2 nA) to give 2K cps spectrum to avoid sum peaks WDS : 3 x 10 -8 A (30 nA) to give 13K cps on Si spectrometer (< 1 % dt)
“The detection limit cannot be reduced indefinitely by accumulating more counts, however, because systematic errors in the background correction eventually become significant. - Stephen Reed Accuracy (not precision) in characterizing the continuum becomes the limiting factor... 4
PPM wt. Other Artifacts: “Holes” in the Continuum
Reality Check: Accuracy at the 400 PPM Level? Note: Blank level (Clevel) can be non-zero
Still… We Need to Improve Sensitivity as well.. PET LPET 5 Spectrometers
NIST SDD 170 ppm 5 Spectrometers 1 ppm EDS is Dead! (normal PET crystal)
TakeOff = 40.0 KiloVolt = 20.0 Beam Current = 50 Un 6 std-flex Results in Elemental Weight Percents ELEM: Hg Pb Cr TIME: 240.00 240.00 240.00 AVER: .09916 -.03815 -.00240 SDEV: .07870 .06759 .00271 Detection limit at 99 % Confidence ELEM: Hg Pb Cr AVER: .00485 .00551 .00280 WDS Analysis of Hg (polymer door frames from suspected Mexican facility) Checked with EDS -count 200 sec - several nA -no Hg found Checked with WDS - count 20 sec - 50 nA - Hg found Why? 990 PPM of Hg easily detected, with 48 PPM sensitivity
Polymer door frames (2000s) from suspected Mexican facility, Check with EDS for 100 sec, 20 keV, 50 nA... nothing... 100 sec counting time
Still nothing... 500 sec counting time
Hg peaks barely visible… 1000 sec counting time, with Be window inserted (to remove C and O)
15 keV, 200nA, 600 sec on-peak, 600 second off peak, Ti Ka, LPET + PET (aggregate intensities) So what exactly can WDS do on a “typical” quantitative analysis?
15 keV, 200nA, 300 sec on-peak, 300 second off peak, Zr La, LPET + PET (aggregate intensities)
Every sample is beam sensitive -at a sufficiently high beam current... SiO2 Glass SiO2 Quartz • Usually thermally insulating samples (e.g., non conductors…) • Classical beam sensitive samples (e.g., alkali, hydrous glasses) • Orientation dependent intensity changes over time (e.g., apatites) • Trace element measurements (high beam currents, long counting) • Use alternating on and off-peak measurements (constant delta) • Extrapolate to zero time intensities • Use a “blank” correction to apply a systematic error offset
Correcting for Intensity Loss (and Gain) Results in Oxide Weight Percents ELEM: Na2O SiO2 Al2O3 MgO TiO2 MnO P2O5 Cl FeO K2O CaO O H2O SUM 169 1.140 72.895 12.112 .065 .080 .052 .007 .174 .502 4.323 .823 -.039 7.867 100.000 170 1.267 72.815 11.824 .069 .143 .032 -.009 .172 .512 4.536 .869 -.039 7.809 100.000 AVER: 1.204 72.855 11.968 .067 .112 .042 -.001 .173 .507 4.429 .846 -.039 7.838 100.000 SDEV: .090 .056 .204 .003 .045 .014 .011 .001 .007 .150 .032 .000 .041 SERR: .064 .040 .144 .002 .032 .010 .008 .001 .005 .106 .023 .000 .029 %RSD: 7.5 .1 1.7 4.2 40.4 33.9 -806.3 .4 1.3 3.4 3.8 -.4 .5 VOL%: 96.461 -2.091 -1.673 ---- ---- ---- ---- ---- 1.218 60.289 ---- ---- ---- DEV%: 18.1 .6 .8 ---- ---- ---- ---- ---- 5.0 6.1 ---- ---- ---- VOLF: LINEAR LINEAR LINEAR ---- ---- ---- ---- ---- LINEAR LINEAR ---- ---- ----
Hyper-exponential Loss Two exponential processes with different decay constants overlapping in time (?) Results in Oxide Weight Percents ELEM: Na2O SiO2 Al2O3 MgO TiO2 MnO P2O5 Cl FeO K2O CaO O H2O SUM 169 1.790 72.897 12.121 .065 .080 .052 .007 .173 .501 4.318 .823 -.039 7.213 100.000 170 1.969 72.817 11.833 .069 .143 .032 -.009 .172 .511 4.530 .868 -.039 7.103 100.000 AVER: 1.879 72.857 11.977 .067 .111 .042 -.001 .173 .506 4.424 .845 -.039 7.158 100.000 SDEV: .127 .056 .203 .003 .045 .014 .011 .001 .007 .150 .032 .000 .078 SERR: .090 .040 .144 .002 .032 .010 .008 .001 .005 .106 .023 .000 .055 %RSD: 6.7 .1 1.7 4.2 40.4 33.9 -806.4 .4 1.3 3.4 3.8 -.4 1.1 VOL%: 201.072 -2.091 -1.673 ---- ---- ---- ---- ---- 1.218 60.289 ---- ---- ---- DEV%: 4.0 .6 .8 ---- ---- ---- ---- ---- 5.0 6.1 ---- ---- ---- VOLF: QUADRA LINEAR LINEAR ---- ---- ---- ---- ---- LINEAR LINEAR ---- ---- ----
Th Mz1 and Mz2 ThSiO4 (Pb free, i.e., “blank”) The Present “state-of-the-art”: MultiPoint Backgrounds: Combined Qualitative and Quantitative acquisition
Fluorescence from Al Continuum Fluorescence from Si Ka Characteristic ~100 PPM Si
The Transmission Electron Probe Nano Analyzer integrates several new detection technologies to optimize compositional characterization with a target spatial resolution of ~10 nm for “as deposited” films and particles in the range of tens to hundreds of nanometers in thickness, while still attached to electron opaque substrates. Back To The Future: A proposal for a TEPNA instrument
Is that my signal? ~50 nm Fe, Nb, Se film on Si wafer (20 keV, 30 nA) Thin films are a trace element problem... Nope… Si sum peak!
18 hour integration at 30 nA can provide significant sensitivity... • Newbury ID “blunders” are still here… • Si sum peak identified as Sn… • Nb peak not identified...
WO3 nano-particles on Si Si sum peak is not 3 sigma, but neither are the W peaks! Like thin films, nano-particles also present a sensitivity problem...
100 nm thick, 0.01 um dia. Requires a 1000 fold improvement in sensitivity! (1,000,000 x fewer atoms but 1000 x thicker film) EPMA WDS Monolayer Detection Demonstrated... 0.1 nm thick, 10 um dia. The increase in signal as a 10 mm diameter beam is scanned over a region containing a monolayer of Hf atoms deposited on a Si substrate using a Cameca SX50
How do we improve sensitivity 1000 fold? • Utilizing high energy emission lines with higher fluorescent yields • e.g., Nb La = 3.5%, Nb Ka = 74% (20-30 fold improvement) • Energy filtering of Be exit windows for high energy emission lines (?) • Why not do it now? Goldstein et. al. 1992
Highest effective fluorescent yields are found for element emission lines whose absorption edges are higher than 8 keV Zn Ka is 9.659 keV Nb Ka is 16.58 keV In 2 cm of Ar 37% of Zn Ka trans. 86% of Nb Ka trans. In 2 cm of Xe .05% of Zn Ka trans. 59% of Nb Ka trans. While still retaining soft x-ray sensitivity!
Reduced continuum signal using “faraday cup” TEM grid holders • - preliminary measurements show a 30% reduction in continuum Other sensitivity improvements are possible... • Small FC and/or large area crystals (3 to 4 fold improvement) • Multiple WDS spectrometers in “aggregate” mode • - 2 to 5 fold improvement using only software • Increased counting time/beam current in electron “transmission mode” • - 30 keV beam through 100 nm of FeS2 loses ~30 eV of energy • - assume 2 to 5 fold improvement by increasing time/current
Transmission Electron Probe Nano Analyzer (TEPNA) An electron beam instrument that integrates several innovations to optimize compositional characterization with a target spatial resolution of ~20 nm for samples in the range of tens to hundreds of nanometers in thickness on various electron opaque substrates. The TEPNA complements existing analytical techniques by providing an unmet need for quantitative compositional analysis conveniently intermediate between that currently achieved by wavelength dispersive x-ray (WDX) electron probe micro analysis (EPMA) and energy dispersive x-ray (EDX) analytical electron microscopy (AEM).
Larger error bars for EPMA reflect actual small scale compositional variation. EPMA vs. LA-ICP-MS
Current/Future Capabilities of High Sensitivity EPMA/TEPNA WDS: Bulk Analysis: presently single digit PPM sensitivity (and accuracy) -AFTER correction of various continuum artifacts, e.g., “blank” Thin Film/Particle Analysis: feasible now for major/minor elements -with typical ~1 um beam diameters on samples >50 nm thick -requires 10-1000 more sensitivity for <50 nm beam TEPNA: Transmission Electron Probe Nano Analyzer - utilize high energy 20-50 nm electron beam (transmission mode) - high fluorescent yield lines (> 8 keV) - tandem gas flow/SDD photon counters (full energy sensitivity) - large area/small FC crystals/spectrometers - aggregate intensities in software