Download
1 / 40
400 likes | 1.18k Views
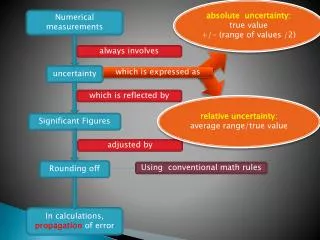
Chapter 2 Describing Data with Numerical Measurements. General Objectives:

E N D
Chapter 2Describing Data with Numerical Measurements General Objectives: Graphs are extremely useful for the visual description of a data set. However, they are not always the best tool when you want to make inferences about a population from the information contained in a sample. For this purpose, it is better to use numerical measures to construct a mental picture of the data. ©1998 Brooks/Cole Publishing/ITP
Specific Topics 1. Measures of center: mean, median, and mode 2. Measures of variability: range, variance, and standard deviation 3. Tchebysheff’s Theorem and the Empirical Rule 4. Measures of relative standing: z-scores, percentiles, quartiles, and the interquartile range 5. Box plots ©1998 Brooks/Cole Publishing/ITP
2.1 and 2.2 Describing a Set of Data with Numerical Measures and Measures of Center Definition: Numerical descriptive measures associated with a population of measurements are called parameters. • Those computed from sample measurements are called statistics. Definition: The arithmetic mean or average of a set is equal to the sum of the measurements divided by n. Notation: Sample mean: Population mean: m • See Example 2.1 for an example of the calculation of the sample mean. ©1998 Brooks/Cole Publishing/ITP
Example 2.1 Use a dotplot to display the n= 5 measurements 2, 9, 11, 5, 6.Find the sample mean of these observations, and compare its value with what you might consider the “center” of these observations on the dotplot. Solution The dotplot in Figure 2.2 seems to be centered between 6 and 8. To find the sample mean, we can calculate The statistic = 6.6 is the balancing point or fulcrum shown on the dotplot. It does seem to mark the center of the data. Figure 2.2 Character Dotplot ©1998 Brooks/Cole Publishing/ITP
Definition: The median m of a set of n measurements is the value of x that falls in the middle position when the measurements are ordered from smallest to largest. • The median is less sensitive to extreme values or outliers than the mean. • See Examples 2.2, 2.3, and 2.4 for examples of the determi-nation of the median. • The value .5(n + 1) indicates the position of the median in the ordered data set. • See Figure 2.3 for examples of the effect of extreme values on the mean and median. ©1998 Brooks/Cole Publishing/ITP
n ©1998 Brooks/Cole Publishing/ITP
Figure 2.3(a) Relative frequency distribution showing the effect of extreme values on the mean and median ©1998 Brooks/Cole Publishing/ITP
Figure 2.3(b) ©1998 Brooks/Cole Publishing/ITP
Definition: The mode is the category that occurs most frequently, or the most frequently occurring value of x. • When measurementson a continuous variable have been grouped as a frequency or relative frequency histogram, the class with the highest frequency is called the modal class. • The midpoint of the modal class is taken as the mode. See Figure 2.4 for examples of the determination of the mode. ©1998 Brooks/Cole Publishing/ITP
Figure 2.4(a)Relative frequency histograms for the milk data ©1998 Brooks/Cole Publishing/ITP
Figure 2.4(b)Relative frequency histograms for the GPA data ©1998 Brooks/Cole Publishing/ITP
2.3 Measures of Variability • Variability or dispersion is a very important characteristic of data. • See Figure 2.5 for examples of variability or dispersion of data. Definition: The range, R, of a set of n measurements is defined as the difference between the largest and the smallest measurements. • SeeFigure 2.6 for anexample of two relative frequency distributions that have the same range but very different shape and variability. • Figure 2.7 shows the deviations of points from the mean. Table 2.1 shows a computation of for the data in Figure 2.7. ©1998 Brooks/Cole Publishing/ITP
Figure 2.5(a)Variability or dispersion of data ©1998 Brooks/Cole Publishing/ITP
Figure 2.5(b)Variability or dispersion of data ©1998 Brooks/Cole Publishing/ITP
Figure 2.6(a)Distributions with equal range and unequal variability ©1998 Brooks/Cole Publishing/ITP
Figure 2.6(b)Distributions with equal range and unequal variability ©1998 Brooks/Cole Publishing/ITP
Figure 2.7 Showing the deviations of points from the mean ©1998 Brooks/Cole Publishing/ITP
Definition: The variance of a population of N measurements is defined to be the average of the squares of the deviations of the measurements about their mean m. • The population variance is denoted by s 2 and is given by the formula • This measure will be relatively large for highly variable data and relatively small for less variable data. Definition: The variance of a sample of n measurements is defined to be the sum of the squared deviations of the measurements about their mean divided by (n -1). ©1998 Brooks/Cole Publishing/ITP
The sample variance is denoted by s2 and is given by the formula: Definition: The standard deviation of a set of measurements is equal to the positive square root of the variance. Notation: n: number of measurements in the sample s2: sample variance : sample standard deviation N: number of measurements in the population s 2: population variance : population standard deviation ©1998 Brooks/Cole Publishing/ITP
The shortcut method for calculating s2 : where = sum of the squares of the individual measurements and = square of the sum of the individual measurements. • The sample variance s2 with (n -1) in the denominator provides better estimates of s 2 than would an estimator calculated with n in the denominator. ©1998 Brooks/Cole Publishing/ITP
For this reason, we always divide by (n -1) when computing the sample variance s2 and the sample standard deviation s. • See Examples 2.5 and 2.6 for examples of the computation of s2 and s 2. • Points to remember about variance and standard deviation: - The value of s is always greater than or equal to zero. - The larger the value of s2 or s, the greater the variability of the data set. - If s2 or s is equal to zero, all measurements must have the same value. - The standard deviation s is computed in order to have a measure of variability measured in the same units as the observations. ©1998 Brooks/Cole Publishing/ITP
2.4 On the Practical Significance of the Standard Deviation Tchebysheff’s Theorem: Given a number k greater than or equal to 1 and a set of n measurements, at least of the measurements will lie within k standard deviations of their mean. • Figure 2.8 illustrates Tchebysheff’s Theorem. Table 2.3 shows some values derived from the theorem. Example 2.7 illustrates its application. • Based on the theorem, at least none of the measurements lie in the interval m -s to m +s. • At least 3/4 of the measurements lie in the interval m - 2sto m + 2s. ©1998 Brooks/Cole Publishing/ITP
Figure 2.8 Illustrating Tchebysheff’s Theorem ©1998 Brooks/Cole Publishing/ITP
At least 8/9 of the measurements lie in the interval m - 3sto m + 3s. • Figure 2.9 shows a normal distribution (mound-shaped). Figure 2.9 Mound-shaped distribution ©1998 Brooks/Cole Publishing/ITP
Empirical Rule: Given a distribution of measurements that is approximately mound-shaped: - The interval (m ± s) contains approximately 68% of the measurements - The interval (m ± 2s) contains approximately 95% of the measurements. - The interval (m ± 3s) contains almost all of the measurements. • The Empirical Rule appliesto data with a normal distribution and many other types of data. • Tchebysheff’s Theorem will always be true, but it is very conservative. • Use the Empirical Rule when the data distribution is roughly mound-shaped. ©1998 Brooks/Cole Publishing/ITP
2.5 A Check on the Calculation of s • Range = 4s or s= Range/4 • Use the range approximation to detect gross errors in calculating, such as the failure to divide the sum of squares of deviations by (n-1) or the failure to take the square root of s2. ©1998 Brooks/Cole Publishing/ITP
2.6 Measures of Relative Standing Definition: The sample z score is a measure of relative standingdefined by • A z-score measures the distance between an observation and the mean, measured in units of standard deviation. • An outlier is an unusually large or small observation. • z-scores between -2 and +2 are highly likely. • z-scores exceeding 3 in absolute value are very unlikely. ©1998 Brooks/Cole Publishing/ITP
Definition: A set of n measurements on the variable x has been arranged in order of magnitude.The pth percentile is the value of x that exceeds p% of the measurements and is less than the remaining (100 - p)%. • Example 2.13 is an example of the use of a percentile. Figure 2.12 shows a percentile on a relative frequency histogram. Figure 2.13 illustrates the location of quartiles. Example 2.13 Suppose you have been notified that your score of 610 on the Verbal Graduate Record Examination placed you at the 60th percentile in the distribution of scores. Where does your score of 610 stand in relation to the scores of others who took the examination? Solution Scoring at the 60th percentile means that 60% of all examina-tion scores were lower than yours and 40% were higher. ©1998 Brooks/Cole Publishing/ITP
Figure 2.12 • The median is the same as the 50thpercentile. • The 25th and 75th percentiles are called the lower and upper quartiles. ©1998 Brooks/Cole Publishing/ITP
Figure 2.13 ©1998 Brooks/Cole Publishing/ITP
Definition: A set of n measurements on the variable x has been arranged in order of magnitude. • The lower quartile (first quartile),Q1,is the value ofx that exceeds one-fourth of the measurements and is less than the remaining 3/4. • The second quartile is the median. • The upper quartile (third quartile), Q3, is the value of x that exceeds three-fourths of the measurements and is less than one-fourth. • When the measurements are arranged in order of magnitude, the lower quartile, Q1,is the value of x in the position .25(n +1). • The upper quartile, Q3, is the value of x in the position .75(n + 1). • When these positions are not integers, the quartiles are found by interpolation, using the values in the two adjacent positions. ©1998 Brooks/Cole Publishing/ITP
See Example 2.14 to illustrate the determination of the lower and upper quartiles. Figure 2.14 gives the Minitab output for the example. Definition: The interquartile range (IQR) for a set of measurements is the difference between the upper and lower quartiles; that is, IQR=Q3 -Q1. • The trimmed mean is the mean of the middle 90% of the measurements after excluding the smallest 5% and the largest 5%. ©1998 Brooks/Cole Publishing/ITP
2.7 The Box Plot • From a box plot, you can quickly detect any skewness in the shape of the distribution and see whether there are any outliers in the data set. To construct a box plot: 1. Calculate the median, the upper and lower quartiles, and the IQR. 2. Draw a horizontal line representing the scale of measurement. 3. Form a box above the line with the ends at Q1 and Q3 . 4. Draw a vertical line through the box at the location of m, the median. ©1998 Brooks/Cole Publishing/ITP
Calculate inner and outer fences as follows: Inner fences: Q1 - 1.5(IQR) and Q3 + 1.5(IQR) Outer fences: Q1 - 3(IQR) and Q3 + 3(IQR) - Measurements between the inner and outer fences are called suspect outliers. - Measurements beyond the outer fences are extreme outliers. - Adjacent values are the largest and smallest measurements before the inner fences. To finish the box plot: - Locate the two adjacent values using the scale along the horizontal axis, and connect them to the box with horizontal lines called whiskers. - Any suspect outliers are marked with an asterisk (*) on the graph, and extreme outliers are marked with a circle (O). ©1998 Brooks/Cole Publishing/ITP
Figure 2.15 shows the various values associated with the box plot. Example 2.15 exhibits the calculations for and the plotting of a box plot. Figure 2.15 • Skewed distributions usually have a long whisker in the direction of the skewness, and the median line is drawn away from the direction of the skewness. ©1998 Brooks/Cole Publishing/ITP
Key Concepts and Formulas I. Measures of the Center of a Data Distribution 1. Arithmetic mean (mean) or average a. Population: m b. Samples of n measurements: 2. Median: position of the median = .5(n +1) 3. Mode 4. The median may preferred to the mean is the data are highly skewed. II. Measures of Variability 1. Range: R = largest - smallest ©1998 Brooks/Cole Publishing/ITP
2. Variance a. Population of N measurements: s 2= b. Sample of n measurements: 3. Standard deviation a. Population: b. Sample: 4. A rough approximation for s can be calculated as s»R/4. The divisor can be adjusted depending on the sample size. ©1998 Brooks/Cole Publishing/ITP
III. Tchebysheff’s Theorem and the Empirical Rule 1. Use Tchebysheff’s Theorem for any data set, regardless of its shape or size. a. At least 1-(1/k2) of the measurements lie within kstandard deviation of the mean. b. This is only a lower bound; there may be more measurements in the interval. 2. The Empirical Rule can be used only for relatively mound- shaped data sets. Approximately 68%, 95%, and “almost all” of the measurements are within one, two, and three standard deviations of the mean, respectively. IV. Measures of Relative Standing 1. Sample z-score: ©1998 Brooks/Cole Publishing/ITP
2. pth percentile; p% of the measurements are smaller, and (100 - p)% are larger. 3. Lower quartile, Q1; position of Q1= .25(n +1) 4. Upper quartile, Q3 ; position of Q3= .85(n +1) 5. Interquartile range: IQR = Q3- Q1 V. Box Plots 1. Box plots are used for detecting outliers and shapes of distributions. 2. Q1 and Q3 form the ends of the box. The median line is in the interior of the box. 3. Inner and outer fences are used to find outliers. a. Inner fences:Q1- 1.5(IQR) and Q1+ 1.5(IQR) b. Outer fences:Q1- 3(IQR) and Q1+ 3(IQR) ©1998 Brooks/Cole Publishing/ITP
4. Whiskers are marked by adjacent values, the last observations in the ordered set before the inner fence. 5. Skewed distributions usually have a long whisker in the direction of the skewness, and the median line is drawn away from the direction of the skewness. Example A set of children’s weights are as follows (to the nearest tenth of a pound): 96.2 100.5 103.3 98.0 96.5 103.0 97.5 98.9 95.5 101.5 100.0 97.0 104.2 100.5 99.5 Determine the mean, median, and modal weight. Solution Mean = 99.5 (1492.1/15) Median = 99.5 (8th rank out of 15) Mode = 100.5 (occurs twice) ©1998 Brooks/Cole Publishing/ITP