Download

1 / 29
290 likes | 314 Views
This text explains the laws of supply and demand, the shifters of demand and supply, the concept of equilibrium, and the effects of price changes. It also covers government price controls and the importance of voluntary exchange in the free market.

E N D
Supply, Demand, and Consumer Choice Do you see the cow?
Review(copy all questions before beginning answers – answer questions in complete sentences (when appropriate) • Explain the Law of Demand • Explain the Law of Supply • Identifythe 5 shifters of demand • Identify the 6 shifters of supply • Define Subsidy • Explain why price DOESN’T shift the curve • Define Equilibrium • Define Shortage • Define Surplus • List 10 stores in the mall
Supply and Demand are put together to determine equilibrium price and equilibrium quantity P Supply Schedule Demand Schedule S $5 4 3 2 1 D o Q 10 20 30 40 50 60 70 80 4
Supply and Demand are put together to determine equilibrium price and equilibrium quantity P Supply Schedule Demand Schedule S $5 4 3 2 1 Equilibrium Price = $3 (Qd=Qs) D o Q 10 20 30 40 50 60 70 80 Equilibrium Quantity is 30 5
Supply and Demand are put together to determine equilibrium price and equilibrium quantity What if the price increases to $4? P Supply Schedule Demand Schedule S $5 4 3 2 1 D o Q 10 20 30 40 50 60 70 80 6
At $4, there is disequilibrium. The quantity demanded is less than quantity supplied. P Supply Schedule Demand Schedule S $5 4 3 2 1 Surplus (Qd<Qs) How much is the surplus at $4? Answer: 20 D o Q 10 20 30 40 50 60 70 80 7
How much is the surplus if the price is $5? What if the price decreases to $2? P Supply Schedule Demand Schedule S $5 4 3 2 1 Answer: 40 D o Q 10 20 30 40 50 60 70 80 8
At $2, there is disequilibrium. The quantity demanded is greater than quantity supplied. P Supply Schedule Demand Schedule S $5 4 3 2 1 How much is the shortage at $2? Answer: 30 Shortage (Qd>Qs) D o Q 10 20 30 40 50 60 70 80 9
How much is the shortage if the price is $1? P Supply Schedule Demand Schedule S $5 4 3 2 1 Answer: 70 D o Q 10 20 30 40 50 60 70 80 10
The FREE MARKET system automatically pushes the price toward equilibrium. P Supply Schedule Demand Schedule S $5 4 3 2 1 When there is a surplus, producers lower prices When there is a shortage, producers raise prices D o Q 10 20 30 40 50 60 70 80 11
Government Price Controls Price Ceiling – set by the government to protect consumers Must be set below equilibrium to be effective Will result in shortages because Qd>Qs
Government Price Controls Price Floor – set by the government to protect producers Must be set above equilibrium to be effective Will result in a surplus because Qs>Qd
Easy as 1, 2, 3 • Before the change: • Draw supply and demand • Label original equilibrium price and quantity • The change: • Did it affect supply or demand first? • Which determinant caused the shift? • Draw increase or decrease • After change: • Label new equilibrium? • What happens to Price? (increase or decrease) • What happens to Quantity?(increase or decrease) • Let’s Practice! Supply and Demand Analysis
Analyze Hamburgers Price of sushi (a substitute) increases New grilling technology cuts production time in half Price of burgers falls from $3 to $1. Price for ground beef triples Human fingers found in multiple burger restaurants. S&D Analysis Practice • Before Change (Draw equilibrium) • The Change (S or D, Identify Shifter) • After Change (Price and Quantity After)
Double Shifts • Suppose the demand for sports cars fell at the same time as production technology improved. • Use S&D Analysis to show what will happen to PRICE and QUANTITY. • If TWO curves shift at the same time, EITHER price or quantity will be indeterminate.
Voluntary Exchange In the free-market, buyers and sellers voluntarily come together to seek mutual benefits.
Voluntary Exchange In the free-market, buyers and sellers voluntarily come together to seek mutual benefits.
Voluntary Exchange In the free-market, buyers and sellers voluntarily come together to seek mutual benefits.
Voluntary Exchange In the free-market, buyers and sellers voluntarily come together to seek mutual benefits.
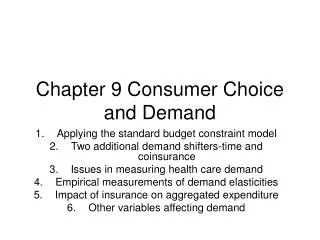
1. Elasticity of Demand • Elasticity of Demand- • Measurement of consumers responsiveness to a change in price. • What will happen if price increase? How much will it effect Quantity Demanded • Who cares? • Used by firms to help determine prices and sales • Used by the government to decide how to tax
Inelastic Demand • General Characteristics of INelastic Goods: • Few Substitutes • Necessities • Small portion of income • Required now, rather than later • Elasticity coefficient less than 1 20% 5%
Elastic Demand • General Characteristics of Elastic Goods: • Many Substitutes • Luxuries • Large portion of income • Plenty of time to decide • Elasticity coefficient greater than 1
Total Revenue Test • Uses elasticity to show how changes in price will affect total revenue (TR). • (TR = Price x Quantity) • Elastic Demand- • Price increase causes TR to decrease • Price decrease causes TR to increase • Inelastic Demand- • Price increase causes TR to increase • Price decrease causes TR to decrease • Unit Elastic- • Price changes and TR remains unchanged • Ex: If demand for milk is INelastic, what will happen to expenditures on milk if price increases?
Is the range between A and B, elastic, inelastic, or unit elastic? 10 x 100 =$1000 Total Revenue 5 x 225 =$1125 Total Revenue A Price decreased and TR increased, so… Demand is ELASTIC 50% B 125%
2. Price Elasticity of Supply • Elasticity of Supply- • Elasticity of supply shows how sensitiveproducers are to a change in price. • Elasticity of supply is based on time limitations. • Producers need time to produce more. • INelastic = Insensitive to a change in price (Steep curve) • Most goods have INelastic supply in the short-run • Elastic = Sensitive to a change in price (Flat curve) • Most goods have elastic supply in the long-run • Perfectly Inelastic = Q doesn’t change (Vertical line) • Set quantity supplied
3. Cross-Price Elasticity of Demand Cross-Price elasticity shows how sensitive a product is to a change in price of another good It shows if two goods are substitutes or complements % change in quantity of product “b” % change in price of product “a” P increases 20% Q decreases 15% • If coefficient is negative (shows inverse relationship) then the goods are complements • If coefficient is positive (shows direct relationship) then the goods are substitutes