Download
1 / 13
170 likes | 667 Views
Thermal interruption performance and fluctuations in high voltage gas circuit breakers. N.P. Basse, M. Seeger, C.M. Franck and T. Votteler ABB Switzerland Ltd. Corporate Research. 33rd IEEE International Conference on Plasma Science, Traverse City, Michigan, USA (2006).

E N D
Thermal interruption performance and fluctuations in high voltage gas circuit breakers N.P. Basse, M. Seeger, C.M. Franck and T. Votteler ABB Switzerland Ltd. Corporate Research 33rd IEEE International Conference on Plasma Science, Traverse City, Michigan, USA (2006)
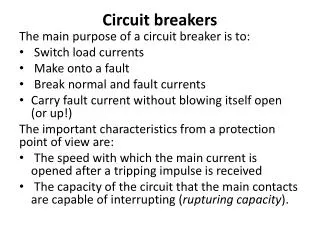
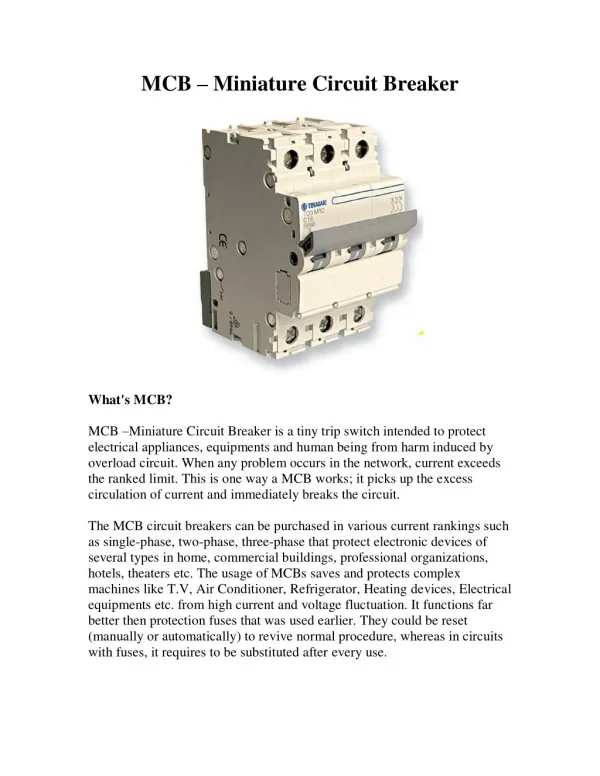
What is a circuit breaker? • General definition by the International Electrotechnical Commission (IEC): “Circuit breakers are mechanical switching devices, capable of making, carrying and breaking currents under normal circuit conditions and also making, carrying for a specified time and breaking currents under specified abnormal circuit conditions such as those of a short circuit. A circuit breaker is usually intended to operate infrequently, although some types are suitable for frequent operation."
12...24 kV 6000...24000 A 50...500 kA 72...800 kV 2500...4000 A 25...63 kA 12...40 kV 400...2500 A 20...50 kA 110...660 kV 10...1250 A 25...100 kA HV substation MV substation transformer ~ MV LV generation transmission distribution Where does one use circuit breakers? • Values above diagram: • Top: System voltage • Center: Rated current • Bottom: Maximal short-circuit current
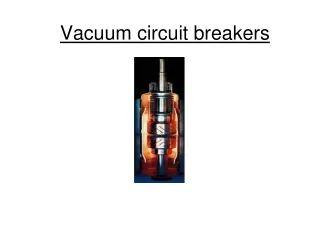
Circuit breaker geometry • Gas: Sulfur hexafluoride (SF6), base pressure 6 bar • Nozzle material: Poly tetra fluoro ethylene (PTFE), i.e. Teflon® • Finger and plug contact material: Copper-Tungsten (20% Cu, 80% W by weight) • Current flows through contacts • Plug is mechanically separated from fingers • Arc forms between the separated contacts • Arc is extinguished at a current zero (CZ) crossing using a combination of flow and turbulence
Circuit breaker testing • Weil-Dobke synthetic test circuit: • On the left-hand side of the gas circuit breaker (GCB) to be tested is the high current part of the circuit. The current peak is typically 60 kA, frequency 50 Hz. • On the right-hand side of the GCB is the high voltage part of the circuit. The voltage peak is typically 30 kV, frequency 1 kHz.
1. High current phase Top right figure: Current (blue) and arc voltage (red). The current is terminated by the vacuum circuit breaker (VCB) after two half cycles. The arc voltage displays a positive extinction voltage and a negative re-ignition voltage close to the first CZ crossing. Bottom left figure: Plug travel (blue) and heating volume pressure (red). Contact separation occurs at 5 mm, vplug = 5.5 m/s. The early pressure oscillations are due to travelling waves in the heating volume.
2. High voltage phase • The spark gap (SG) is fired just before CZ and injects a high frequency current. • When the GCB interrupts the injected current, it is stressed by the transient recovery voltage (TRV) oscillating in the high voltage circuit across the GCB. The figure shows a „fail/hold“ sequence: The first CZ is a failure to interrupt, whereas the second CZ is a successful interruption (or hold).
Circuit breaker performance evaluation Using the empirical scaling formula di/dtlimit = di/dtmeasured (Rmeasured/Rcritical)1/m, where Rmeasured is the arc resistance 500 ns before CZ, m = 2.8 and Rcritical is a constant, one can map di/dtmeasured at holds and fails to di/dtlimit. The figure shows di/dtlimit as a function of heating volume pres- sure. The red curve shows the fit di/dtlimit p1.0. However, we expect a p0.4 scaling based on previous experiments. Additional measurements will be added to our analysis to clarify this issue.
Pressure spectrogram • Spectral analysis of the heating volume pressure reveals large fluctuations over the entire bandwidth of the detection system (3 dB point at 30 kHz). • The two vertical lines are due to initiation of high current (left) and spark gap discharge (right).
Pressure band autopower Top right figure: To enable a systematic analysis of the pressure fluctuations, we use the band autopower, i.e. the frequency integrated spectrogram vs. time. For our scaling studies we use the average band autopower amplitude. Bottom left figure: Relative fluctuation level vs. maximum heating volume pressure. The red curve shows the fit δp/p pmax0.4.
Pressure cross correlation • Two pressure sensors are used, displaced 180° in the heating volume. • The cross correlation between those measurements shows both stationary and propagating structures. • Negative timelag: Sensor 1 detects signal first.
Conclusions • Synthetic tests in the ABB high power lab allow us to mimic a real circuit breaker environment • A comprehensive set of diagnostics is used to (i) derive scaling laws of circuit breaker performance and (ii) build an improved physical understanding of the arc interruption processes • On the diagnostics side, we will focus on the testing of new pressure sensors, providing more mechanical stability and a higher frequency response • Links to computational fluid dynamics simulations: • Reproduce observed correlations between pressure sensors using 3D simulations (ongoing) • Quantify connection between fluctuations in the arcing zone and heating volume (future) • Validate turbulence models used in the simulations (future) • For further information, please either • send me an e-mail (nils.basse@ch.abb.com) or • visit my homepage (www.npb.dk)