Download
1 / 62
640 likes | 1.09k Views
Image Classification and Others. Ruiliang Pu Ecosystem Science Division Department of ESPM University of California, Berkeley, USA March 02, 2004. Outline. What is image classification? General classification procedures General classifiers Accuracy assessment

E N D
Image Classificationand Others Ruiliang Pu Ecosystem Science Division Department of ESPM University of California, Berkeley, USA March 02, 2004
Outline • What is image classification? • General classification procedures • General classifiers • Accuracy assessment • Identify data needs & establish database • Applications • Summary
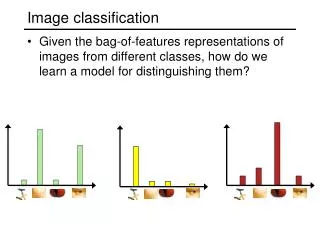
What is image classification? Image classification • A process of assigning pixels in an image to one of a number of classes. • As a result of image classification, a thematic map is generated. • Conventional multispectral classification techniques perform class assignments based only on the spectral signatures of a classification unit. • Contextual classification refers to the use of spatial, temporal, and other related information, in addition to the spectral information of a classification unit in the classification of an image. • A classification unit could be a pixel, a group of neighbouring pixels or the whole image
Imagery Classification Supervised Classification Unsupervised Classification Maximum Likelihood classification ISODATA • a prior knowledge is required • more controlled by users • More computer-automated
Procedure of supervised classification • Training samples • Signature generation and evaluation • Decision rule
Training samples • Samples of homogeneous areas with known class (land-use / land-cover ) types • Selection of training samples • fieldwork • aerial photography • maps • personal experience
Parametric signatures • Multivariate statistical parameters Maximum, minimum, mean, standard deviation, covariance matrix • Spectral characteristics of training samples are used to generate signatures • Signature can be evaluated, deleted, renamed and merged (i.e., editing signatures) • The pixels in the image are sorted into classes based on the signatures, by use of a classification decision rule
Decision rules • A mathematical algorithm that performs the actual sorting of pixels into distinct classes. • Examples of decision rules • Parallelepiped • Minimum Distance • Maximum Likelihood/Bayesian • Mahalanobis Distance
Unsupervised classification (clustering) • Only some parameters are required to specify from the user to begin this process. • Then the computer uses these parameters to uncover statistical patterns that are inherent in the data. • Spectral classes do not necessarily correspond to any meaning characteristics of ground objects. • After classification, the users must attach the actual meaning to the resulting classes.
Iterative Self-Organizing Data Analysis Technique A (ISODATA) • Uses minimum spectral distance to assign a cluster for each candidate pixel. • Is iterative in that it repeatedly performs an entire classification and recalculates statistics. • Three parameters must be specified: • N – the maximum number of clusters to be considered. Since each cluster is the basis for a class, this number becomes the maximum number of classes to be formed; • T – a convergence threshold, which is the maximum percentage of the pixels whose class values are allowed to be unchanged between iterations; • M – the maximum number of iterations to be performed.
ISODATA clustering procedure • Begins by determining N arbitrary cluster means. • The spectral distance between the candidate pixel and each cluster mean is calculated. The pixel is assigned to the cluster whose mean is the closest. • After each iteration, the means for each cluster are recalculated, based on the actual spectral locations of the pixels in the clusters, causing them to shift in feature space. Then these new means are used for defining clusters in the next iteration. • The process will terminate until either the convergence threshold T or the maximum number of iterations M is reached
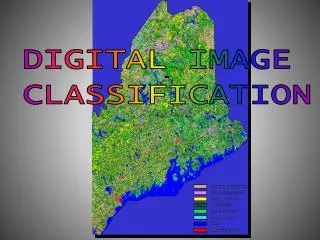
Image classification and thematic mapping • According to image characteristics • Multi-spectral • Hyperspectral • Spatial
Image classification and thematic mapping Unclassified Classified
General image classification procedures • Design image classification scheme: They are usually information classes such as urban, agriculture, forest areas, etc. Conduct field studies and collect ground information and other ancillary data of the study area. • Preprocessing of the image, including radiometric, atmospheric, geometric and topographic corrections, image enhancement, and initial image clustering. • Select representative areas on the image and analyze the initial clustering results or generate training signatures. • Image classification • Supervised mode: using training signature • unsupervised mode: image clustering and cluster grouping • Post-processing: complete geometric correction & filtering and classification decorating. • Accuracy assessment: compare classification results with ground truth. Gong and Howarth 1990 PE&RS
1. Multi-spectral classification • Minimum distance classification • Euclidean distance • City block • Mahalanobis distance • Maximum likelihood classification • Clustering • K-mean • ISODATA • Fuzzy C-mean • Spectral unmixing
Maximum likelihood classification (MLC) • Assumption: data for each class is normally distributed • Let C=(C1, C2, …, Cnc) denote a set of nc classes. For a given pixel with gray level vector x, the probability that x belongs class Ci is P(Ci|x) , i=1, 2, …, nc. • x will belong to class Ci, if P(Ci|x) P(Cj|x) for all ji. http://nature.berkeley.edu/~gong/textbook/
2. Hyperspectral classification • Feature reduction/extraction • Principle component analysis (PCA) • Linear discriminant analysis (LDA) • Penalized discriminant analysis (PDA) • Segmentation-based feature reduction • Spectral unmixing • Orthogonal subspace projection • Spectral matching • Binary coding • Vectorisation Xu B. and P. Gong, Land use/cover classification with multispectral and hyperspectral EO-1 data, submitted, Photogrammetric Engineering & Remote Sensing
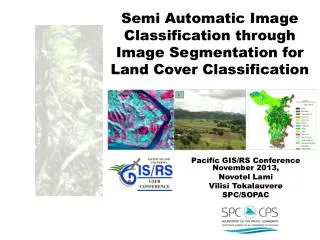
3. Spatial classification • Contextual • Texture • Spectral unmixing and spatial neighborhood • Markov random field
Accuracy assessment • To compare the classification results with the ground truth (reference)
Confusion (error) matrix • Overall accuracy • Commission error, omission error http://nature.berkeley.edu/~gong/textbook/
USGS Base Spatial Data • Maps • DRG: digital raster graphic • DLG: digital line graph • DEM: digital elevation model • Aerial photography • DOQ:digital orthophoto quadrangles • Satellite imagery • Land cover characterization • NHD: national hydrography dataset • NED: national elevation dataset http://ask.usgs.gov/products.html
Maps • Topographic maps • 1:24K • 1:100K • 1:250K • Thematic Maps • Earthquake, flood, • vegetation, ecoregions • geologic
Maps • Map indexes • www.maplink.com • www.geocomm.com/faq/1.html • mapping.usgs.gov Then: MapFinder • National mapping standards • http://mapping.usgs.gov/standards/
DRG • TIF files • TFW headers • Most are in NAD 27 • UTM
DLG • Transportation • Hydrology • Contour lines • Boundaries • 24K, 100K, 2M
DLG American Samoa | Federated States of Micronesia (Yap, Kosrae, Pohnpei, Truk) | Guam | Northern Mariana Islands | Republic of Palau | Disclaimer [ AL | AK | AR | AS | AZ | CA | CO | CT | DE | FL | FM | GA | GU | HI | IA | ID | IL | IN | KS | KY | LA | MA | MD | ME | MI | MN | MO | MP | MS | MT | NC | ND | NE | NH | NJ | NM | NV | NY | OH | OK | OR | PA | PR | PW | RI | SC | SD | TN | TX | UT | VA | VI | VT | WA | WI | WV | WY ]
DEM • 7.5 – minute • NAD27 • NAD83 • 30m, 10m, 5m • 1 degree • 15 minute blocks • WGS72 • WGS84
GIS digital data sources • USGS maps and other products: • http://ask.usgs.gov/products.html • http://mac.usgs.gov/mac/isb/pubs/booklets/usgsmaps/usgsmaps.html • USGS digital maps and data: • http://ask.usgs.gov/digidata.html • Geo-community online resource for GIS and geospatial data: • http://data.geocomm.com/ • http://www.gisdatadepot.com/catalog/US/61069/1532/index.html • FTP site for USGS data: • ftp://edcftp.cr.usgs.gov/pub/data/
Example of Geo-community GIS data of Alameda County, California, United States Digital Elevation Models (DEM) - 24K Digital Line Graphs (DLG) - 100K Digital Line Graphs (DLG) - 24K Digital Orthophotos (DOQ/DOQQ) - 1 Meter Digital Raster Graphics (DRG) - 100K Digital Raster Graphics (DRG) - 24K Digital Raster Graphics (DRG) - 250K FEMA Q3 Flood Data Landuse/Land Cover - 100K Landuse/Land Cover - 250K NWI Wetlands - 24K - ARC/INFO Format US Census Bureau TIGER/Line 2000 Files
Data Viewer and software • Public domain software for DLG, DRG and SDTS (spatial data transfer standard) data: • http://mcmcweb.er.usgs.gov/sdts/public_domain.html • Geo-community software (SDTS translator): • http://software.geocomm.com/translators/sdts/ • Geo-community data viewer: • http://software.geocomm.com/viewers/general/ • LizardTech Product Downloads including (MrSID for the DOQQ) • http://www.lizardtech.com/download/ • Landsat Global Viewer • http://glovis.usgs.gov
Remotely sensed data sources • USGS and NASA Distributed Active Archive Center (DAAC) • http://edcdaac.usgs.gov/dataproducts.html • Example: • Satellite Imagery • Landsat 7 ETM+ • Terra ASTER • Terra MODIS • Landsat Pathfinder • NASA Science Data Purchase • AVHRR • Elevation • Global 30 Arc-Second Elevation Data Set • Land Cover • Global Land Cover Characterization • Airborne Imagery • Airborne Imagery • RADAR • SIR-C • Shuttle Radar Topography Mission (SRTM)
Remotely sensed data sources • USGS EROS Data Center - Seamless Data Distribution System • http://seamless.usgs.gov/ • Data Set Information can be found at: • National Elevation Dataset (NED) • National Land Cover Dataset (NLCD) 1992 • Shuttle Radar Topography Mission (SRTM) • USGS Satellite Image Purchase • http://earthexplorer.usgs.gov
Satellite images • Landsat • http://edc.usgs.gov/products/satellite.html • MODIS • http://edc.usgs.gov/products/satellite/modis.html • ASTER • http://edc.usgs.gov/products/satellite/aster.html • Earth Observing 1 • http://eo1.usgs.gov/
Land Cover • LULC 1970s • NLCD 1992 and 2000 • http://landcover.usgs.gov/ • http://edcw2ks15.cr.usgs.gov/lccp/nlcd_db.asp • Global land cover and National land cover
Other spatial data • TIGER/Demographic Files • www.esri.com/data/download/ • census2000_tigerline/index.html • Digital Soils Data • www.ftw.nrcs.usda.gov/ssur_data.html
Health related data resources • National Atlas • http://nationalatlas.gov/ • Download National Atlas map layers in the format of Shapefile, SDTS, GEOTIFF, DBF • http://nationalatlas.gov/atlasftp.html • USGS National wildlife health center • http://www.nwhc.usgs.gov/