ECOLOGICAL FOOTPRINTS
ECOLOGICAL FOOTPRINTS. By Ellen Murray Rosedale Heights School of the Arts, TDSB ellen1.murray1@gmail.com For OSEE 2010 http://www.breathingearth.net/. Why teach about Ecological Footprints (EF)? . It’s a way to personalize scientific data


ECOLOGICAL FOOTPRINTS
E N D
Presentation Transcript
ECOLOGICAL FOOTPRINTS By Ellen Murray Rosedale Heights School of the Arts, TDSB ellen1.murray1@gmail.com For OSEE 2010 http://www.breathingearth.net/
Why teach about Ecological Footprints (EF)? • It’s a way to personalize scientific data • Allows to students to connect their lifestyle choices and the use of Earth’s resources • Online EF calculators give students immediate feedback about how lifestyle choices increase or decrease resource usage • They can quickly see the impact of food, transportation, housing and consumption choices on their EF
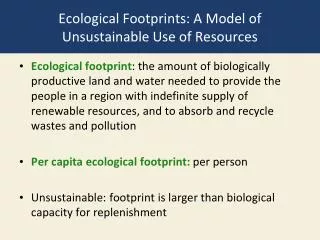
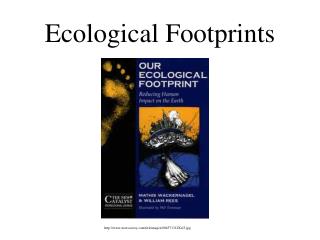
What are ecological footprints? “Ecological footprints are an accounting tool that enables us to estimate the resource consumption and waste assimilation requirements of a defined human population in terms of a biologically productive land area.” Adapted from “Our Ecological Footprint” by Mathis Wackernagel and Bill Rees (1995)
67% Low-Productivity Ocean 4% Biologically Productive Ocean 18% Biologically Productive Land 11% Deserts, Ice Caps and Barren Land
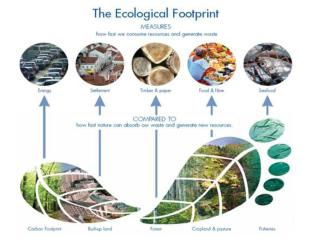
Calculating an Ecological Footprint (EF) • EF = land to produce food + land and water to absorb CO2 waste + land for housing, buildings and roads + land to provide for all consumer goods and services • Ecological footprints are measured in hectares
So how big is a hectare? 1 hectare = 100 m x 100 m 1 hectare = about 1.3 soccer field
How many hectares are available? • Using EF calculation methods there are about 15.7 ha of biologically productive land available per person • As population increases, the available per capita biologically productive land decreases • And as humans degrade ecosystems, less biologically productive land is available
What is an average Canadian’s EF? • Individual Canadians have an average EF = 70 ha (700,000 m2 or 85 soccer fields) • We have one of the largest ecological footprints worldwide • The available EF land per person = 15.7 ha • Worldwide the average person has an EF = 23 ha
EF Calculators Some good websites include: • The best ecological footprint calculator is Ecological Footprint Quiz by Redefining Progress http://www.myfootprint.org/ • Good for intermediate level students is www.wwf.org.uk • For a choice of both adult and kid options try www.footprintnetwork.org
Taking the Ecological Footprint Quiz • Student preparation requires • Estimated apartment or house size and lot size • Estimated family income • Estimated kilometres travelled per year • By car • By bus • By subway or train • By plane • The best ecological footprint calculator is Ecological Footprint Quiz by Redefining Progress http://www.myfootprint.org/
Ecological “Overshoot” • According to the WWF Living Planet Report we are using the Earth’s resources 25% faster than the resources can be renewed
Taking Action • Young people need positive messages • YES WE CAN fix the environmental problems we have created • We can buy less - watch the Story of Stuff by Annie Leonard online • Start Ecoschools programs • Plant trees • Walk and cycle more • Waste less food • Wear a sweater
Students Research Biocapacity Availability for Other Species • This discussion has focussed exclusively on human use of the Earth’s resources • How much of Earth’s resources should be allocated to plants and animals? • If we continue to decrease biodiversity we will also harm our own species
“Old” EF Math vs “New” EF Math • The EF calculation results are often different depending on the UN data collection year and the calculation method • In 2005, the organization Redefining Progress released a new methodology for calculating EF called EF-NPP • This resulted in a large increase in the results of an ecological footprint calculation • The new method also gave much larger values for Earth’s biologically productive land calculations
“OLD” EF MATH • The old method was EF-GAEZ • To convert old values to new values multiply by 8.5
Young people know the problems. • We need to help them work on solutions for the future. • Teach sustainability, live sustainably, be hopeful, be happy and take students outside often. • Thank you for attending
Calculating all the big environmental impact categories • Life Cycle Assessment (LCA) is the broadest indicator and an internationally standardized method (ISO 14040 and ISO 14044). It not only evaluates the impact on climate change, but also other impact categories such as acidification potential, eutrophication potential, ozone depletion potential, and ground level ozone creation. For each of these impact categories, the product or system is evaluated over its complete life span, from the extraction of raw material and manufacturing, to the use of the product by final consumers and end-of-life processes like recycling, energy recovery, and ultimate waste disposal. • The ISO standards provide robust and practice-proven requirements for performing transparent LCA calculations. Moreover, one can make use of extensive databases containing life cycle profiles of many goods and services, as well as many of the underlying materials, energy resources, transport systems, etc. Nevertheless, LCA calculations remain very complex and should therefore be applied only by professionals and preferably to a specific unit or application, such as a washing machine or a car tire. • Calculating the impact on climate change • A Carbon Footprint, also called Carbon Profile, is an LCA with the analysis limited to emissions that have an effect on climate change (carbon dioxide, methane, etc.). This limitation makes it easier to apply the calculation to integrated systems, such as an entire house or automobile. • Comparing with the amount of land needed • The Ecological Footprint of an activity tries to measure its consumption of natural resources and the amount of biologically productive land and sea needed to regenerate those resources and to absorb and render harmless the waste that is produced. While this measure is being increasingly used, it is not a scientific standard and is widely criticized. The translation of every impact into land and sea areas is neither self-evident nor is it easily established. Consequently, various methodologies are in use that sometimes give conflicting results. The calcultions also largely depend on the prevailing technologies, meaning that their results are evolving with the state of technology. Nevetheless, being fully aware of its limitations, Ecological Footprint calculations can sometimes be used to establish a first rough approximation of the ecological impact of a product or a system. • http://www.leonardo-energy.org/lca-carbon-footprint-and-ecological-footprint
The first, the Living Planet Index, measures biodiversity, based on trends in more than 3,600 populations of 1,300 vertebrate species around the world. In all, data for 695 terrestrial, 344 freshwater and 274 marine species were analyzed. Terrestrial species declined by 31 per cent, freshwater species by 28 per cent, and marine species by 27 per cent. • The second index, the Ecological Footprint, measures humanity’s demand on the biosphere. Humanity’s footprint has more than tripled between 1961 and 2003. This report shows that our footprint exceeded biocapacity by 25 per cent in 2003. In the previous report (based on data to 2001), this figure was 21 per cent. The carbon dioxide footprint, from the use of fossil fuels, was the fastest growing component of our global footprint, increasing more than ninefold from 1961 to 2003. • Countries of over a million people with the largest footprint, in global hectares per person, are the United Arab Emirates, the United States of America, Finland, Canada, Kuwait, Australia, Estonia, Sweden, New Zealand and Norway. China comes mid-way in world rankings, at number 69, but its growing economy and rapid development mean it has a key role in keeping the world on the path to sustainability.
Live Well on Less • Studies show that the more we consume the less happy we are