Voltage Security Margin Assessment
Voltage Security Margin Assessment. Liang Zhao Nirmal-Kumar C Nair Professor Dr. Garng Huang Industrial Advisory Board Meeting December 6-7, 2001. PS ERC. Voltage Security Margin Assessment. Tasks Modeling of control devices, loads and transactions for stability evaluations

Voltage Security Margin Assessment
E N D
Presentation Transcript
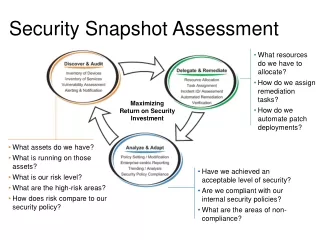
Voltage Security Margin Assessment Liang Zhao Nirmal-Kumar C Nair Professor Dr. Garng Huang Industrial Advisory Board Meeting December 6-7, 2001 PSERC
Voltage Security Margin Assessment Tasks • Modeling of control devices, loads and transactions for stability evaluations • Use of stability margin and stability index calculations • Transaction based stability margin and utilization factors calculation Implementation • Voltage stability studies and modeling issues • Stability index for static voltage security analysis • Dynamic stability index issues • A new OPF based algorithm to evaluate load curtailment incorporating voltage stability margin
Effect of FACT Components on Voltage Stability Margin SVC TCSC
Publications • An OPF based Algorithm to Evaluate Load Curtailment Incorporating Voltage Stability Margin Criterion ( North Atlantic Power System Conference 2001) • Voltage Stability Constrained Load Curtailment Procedure to Evaluate Power System Reliability Measures (To be presented at IEEE-PES Winter Meeting 2002) • An XML based CIM compliant Real-time Load flow data exchange approach amongst proprietary Energy Management Systems (To be Communicated : Journal of Computer Applications to Power Systems) • Incorporating TCSC into Voltage Stability Constrained OPF (To be Communicated :IEEE-PES Summer Meeting 2002)
Present Focus • Investigating the effect of FACT components on the steady state voltage stability margin • Incorporating the FACT component parameters into the voltage stability constrained OPF algorithm formulated by the authors • Investigating the dynamic voltage collapse phenomenon following a major disturbance like fault with associated control components like TCSC, Tap changers etc. • To identify the locally measurable quantities to predict the voltage collapse of the system
Voltage Security Margin Assessment Liang Zhao Nirmal-Kumar C Nair Professor Dr. Garng Huang March 22, 2002 PSERC
Voltage Security Margin Assessment Recent Implementation • Incorporating TCSC into the voltage stability constrained OPF (VSCOPF) formulation. • Investigate into dynamic voltage collapse issues. • Applicability of index L to detect dynamic voltage collapse during: • Slowly increasing loading • Sudden large load increase • Loss of line • Data Communication Issues amongst EMS
TCSC Incorporated VSCOPF algorithm Steady State Model of TCSC
Observations • TCSC improves line flow distribution, hence effectively reducing load curtailment • A steady state TCSC description could be effectively integrated into the VSCOPF algorithm • By effectively redistributing reactive flows, TCSC is observed to relieve a voltage stability constrained system operation • The simulation shows the TCSC could be used as a congestion management and voltage stability margin enhancement tool
Dynamic Voltage Collapse Detection Slow increase in Bus 5 load Large Sudden increase in Bus 5 load
Observations Modeling and Simulation • Modeling of all the components of the test system were created in EUROSTAG (To run time-domain simulations) • Generator voltage regulator and governor dynamics were incorporated in the simulations Results of Simulation • Slow changing loading, sudden large loading and loss of line situations were investigated. For the last two cases, it was observed that the dynamic voltage collapse loadability was less than the steady state loadability for the system. • For slowly increasing load the index L was able to track the voltage collapse situation effectively • For a step increase, the index evaluated at the first largest dip of voltage is able to track the dynamic collapse of the system • For a loss of line scenario, the index evaluated at the first dip of voltage approximately approaches unity at dynamic collapse loading.
Related Publications • Incorporating TCSC into Voltage Stability Constrained OPF formulation (Communicated :IEEE-PES Summer Meeting 2002) • Detection of Dynamic Voltage Collapse (Communicated :IEEE-PES Summer Meeting 2002) • An XML based CIM compliant load flow/state estimation data exchange approach amongst proprietary Energy Management Systems (To be Communicated : Journal of Computer Applications to Power Systems)
Contribution Allocation for Voltage Stability In Deregulated Power Systems----A new application of Bifurcation Analysis Dr.Huang Kun Men Texas A&M University PSerc Review Meeting College Station, March 22, 2002 PSERC
Generation Companies Generation Generation Transactions of the system Distribution Responsibility Power Companies Distribution Transmission Companies Load (Utilities) SystemControl SystemControl Integrated Companies Two model of the power system Traditional Operation Model of Power System New Operation Model of Power System based on the transaction (The voltage collapse could be due to different parts of the system)
steady-state margin VS dynamic stability margin • Steady-state margin is easier to find by power flow analysis, and is usually bigger than the dynamic stability margin. • Steady-state margin does not take the dynamic response of the system into account, and it is possible to have a voltage collapse inside the steady-state margin. For many cases, the dynamic stability margin is the real margin for the voltage stability. • Analyzing the dynamic stability margin and its relationship with system components, we can effectively predict and avoid voltage collapses. We can also allocate the contribution of devices to the stability margin. • The dynamic stability margin is usually obtained by dynamic analysis (Here we use bifurcation analysis), which is more time consuming than the power flow analysis.
steady-state margin VS dynamic stability margin • Dynamic stability margin is determined by Hopf bifurcation point (denoted as A), or by a saddle-node bifurcation point(denoted as B). The size of the exciter and the the generator limits will have. • Steady-state stability margin is determined by singularity induced bifurcation point (C), which can be computed from power-flow function. But when a P-regulator (Efd0 is constant, shown as below figure, C is in the lower part of the PV curve, B equals to Pmax) is used, the steady-state margin could be the B point, which can be obtained by solving the equations of exciter, regulator and the power-flow. It is a steady-state method that involves more than power flow analysis.
Power flow steady-state Analysis VS dynamic analysis 1. When the steady state analysis is good enough? (Here we assume that regulator is well tuned.) 1) The transmission line is not too long, x is not very large and the regulator is not P-regulator (Efd0 is constant) 2) The xd is not too large and the regulator is not a P-regulator (Efd0 is constant) 3) The exciter is reasonably large in terms reactive power capacity. For these cases, we found that steady-state stability margin equals to dynamic stability margin, it determines the stability margin, so steady state analysis is good enough.
2. When steady state analysis is not good enough? How would it happen? 1) The transmission line is too long, x is very big . 2) The xd is too big. 3) The regulator is a P-regulator with Efd0 is constant 4) The regulator is not well tuned; for example, the Kp is too small, even the x and xd are not very big. 5) when the exciter hits the limit. In these cases, we found that the dynamic stability margin is usually smaller than the steady-state margin, and the dynamic stability margin determines the stability margin. We will explain the phenomenon by the bifurcation analysis.
Our research focus on two fields: 1.How to allocate the contribution/responsibility by bifurcation analysis. Three typical bifurcations are used here: 1) Hopf bifurcation point, we denote it as A 2) Saddle node, we denote it as B 3) Singularity induced bifurcation point, we denote is as C 2. How the capacity limits and parameters of the system influence the bifurcation points? 1) The parameters of the generator 2) The parameters of the transmission line 3) The influence of the reserve limits on the voltage stability a. The influence of the size of the exciter b. The influence of other limits of the system
Load Exciter A simple one generator and one load bus system is studied to demonstrate our analysis. (It include three basic part: Exciter & Regulator, Generator and Transmission part.) In the above system, we assume that the power factor of the load is constant as the load changes. We also assume that the voltage dynamic is decoupled from the angle dynamic, which is well behaved, and the angle dynamic can be approximated out.
Reduced Jacobian matrixis used here to find the bifurcations. Differential equation denote the dynamic model of dynamic control devices, such as exciter, generator,…, and so on. Algebraic equation denote the power flow. x: State variable of control devices; y: Power flow variable; p: load and system topography parameter….
Topic 1: How to identify the responsibility by bifurcation analysis? First, we will show that if there is no voltage regulator control, the PV curve of the system will be changed drastically: The PV curve with and without controller Above figure shows that the Pmax will increase with a controller to keep the Eg≡Er, which implies that the regulator will increase the stability margin. (Note: the regulating range of a voltage regulator is decided by its exciter size )
Then we focused on three widely used controller: 1) P-controller ( , Efd0 is rescheduled as load change to keep Eg as Er) The above figure shows that how the three bifurcations vary with the change of KP
When KP=2.5, 5, 10, the below figures shows that how the eigenvalue vary with the change of KP In these figures, note that Kp has little influence on one of the eigenvalues (denoted by EigT), while Kp has a substantial impact on the other eigenvalue (denoted by EigC).
Through the analysis and Figures showed above, we can see that there are three basic patterns : 1)A<B<C. When P∈(A,B), both the eigenvalue EigT and EigC are positive; when P∈(B,C), only the eigenvalue EigT is positive. 2)A<C<B. When P∈(A,C), both the eigenvalue EigT and EigC are positive; when P∈(C,B), only the eigenvalue EigC is positive. 3) A disappear and B<C. Only the eigenvalue EigT is positive when P∈(B,C)
2) PI-controller (Kp=2.5, TI=5.0 ) and PID-controller (Kp=2.5, TI=5.0, KD=1,TD=0.01 ) When P∈(A,C), both the eigenvalue EigT and EigC are positive; when P∈(C,B), only the eigenvalue EigC is positive. We can see that the bifurcation locations of PI and PID controller are very similar with the P controller when Kp→∞ , it is included in the basic pattern 2.
Conclusion for topic 1: An easy way to identify responsibility between the controller and transmission 1)A<B<C. When P∈(A,B), both EigC and EigT are positive; when P∈(B,C), only the EigT is positive. From the parameter analysis, we can conclude that the voltage collapse is due to both controller and transmission when P∈(A,B). The voltage collapse is only caused by transmission part when P∈(B,C). In this case, [A, C] is the unstable area, and A defines the dynamic stability margin boundary—the real stability margin of the system. 2) A<C<B. When P∈(A,C), both EigC and EigT are positive; when P∈(C,B), only the EigC is positive. From the parameter analysis we can conclude that the voltage collapse is due to both controller and transmission when P∈(A,C). The voltage collapse is caused by controller when P∈(C,B). In this case, [A, B] is the unstable area, and A defines the dynamic stability margin boundary —the real stability margin of the system. 3) A disappears and B<C, only the EigT is positive when P∈(B,C). Thus, the voltage collapse is only due to transmission when P∈(B,C). In this case, [B, C] is the unstable area, and B is the dynamic stability margin boundary —the real stability margin of the system.
Conclusion for topic 1:continued • 4) The tuning of the control parameters will influence point A and thus the dynamic stability margin of the system. The contribution with and without the controller / regulator can be easily assessed. • 5)The analysis also explains why a dynamic stability margin is smaller than the static analysis.
Topic 2: Influence Of Capacity Limits and Other System Parameters On Stability: 1) The parameter of the generator (xd) a) P-controller: (KP=2.5) b) PI-controller: (KP=2.5,TI=5.0) c) PID-controller: (KP=2.5, TI=5.0, KD=1.0, TD=0.01) Note:For case a),b) and c), A point (determine the dynamic stability margin) is the real stability margin
Topic 2: 2) The parameter of the transmission (x) a) P-controller: (KP=2.5 , xd=1.2) b) PI-controller: (KP=2.5,TI=5.0 , xd=1.2) c) PID-controller: (KP=2.5, TI=5.0, KD=1.0, TD=0.01, xd=1.2) Note:For case a),b) and c), A point (determine the dynamic stability margin) is the real stability margin
Topic 2: 3) The influence of the capacity limits a) The influence of the size of the exciter When Efd hit the limit Efd max, the input Efd of the exciter will keep as Efd max, there are two basic patterns: Pattern 1: The cross point of the two PV curve is in the lower part of the PV curve which have no regulator. Right figure show that how the voltage change with P when there is a limit Efd max=2.0, we can see that when exciter hit the limit at point D, the voltage will increase with the bigger P. In this basic patter, there are several possibilities for the dynamic stability margin: • A<D, then the dynamic stability margin is A • A>D and C1<D, then the dynamic stability margin is D • A>D and C1>=D, then the dynamic stability margin is C1. • For the steady stability margin, there are also several possibilities: • C<D, then the steady-state margin is C • C>D and C1<D, then the steady-state margin is B1 • C>D and C1>=D, then the steady-state margin is C1.
Pattern 2: The cross point of the two PV curve is in the upper part of the PV curve which have no regulator • In this basic patter, there are also several possibilities for the dynamic stability margin: • A<D, then the dynamic stability margin is A • A>D ,then the dynamic stability margin is B1 • For the steady stability margin: • C<D, then the steady-state margin is C • C>D, then the steady-state margin is B1 When the dynamic stability margin is A, the regulator determines the dynamic stability margin, and thus the regulator is responsible for the voltage collapse; Otherwise the size of the exciter determines the dynamic stability margin and the exciter (or a regulator such as SVC) is responsible. When the stability margin is C, the regulator determines the steady-state stability margin, and the regulator is responsible; Otherwise (B determines the margin) the the size of the exciter determines the stability margin, and the exciter is responsible. It is clearly that D and B1 will increase with bigger Efd max, thus, bigger size of exciter contributes to both the increase of the dynamic and steady-state stability margins.
Topic 2: 3) b) The influence of limits of the Generator · Section E–F–G of the curve shows limits due to stator (armature) current. This section is a portion (arc) of a circle that has its center in the origin of – (MW-Mvar) coordinates of the generator. · Section D–E of the curve shows limits due to field current limitations. This is a portion (arc) of a circle that has its center on the Y axis (Mvar) and shifted from the origin by a value proportional with the machine short-circuit ratio (SCR). · Section H–G of the curve shows limits due to over-heating of the stator core end when the generator is under-excited in conditions of leading PF, when the generator is absorbing Mvars
Three Basic Pattern: i) Three bifurcation points A,B and C are all located outside the boundary D-E-F-G-H, so F is the stability margin (Here we neglect the limit of the prime motor—Pm, it is clear that if Pm is less then F, then Pm will be stability margin). ii) A or B appears within the boundary D-E-F-G-H, C is out of this boundary, so F replace C to be the steady-state stability margin, the point A or B (when A disappear) will be the dynamic stability margin—the actualstability margin here. iii) A,B and C are all within the boundary D-E-F-G-H, the point A or B (when A disappear) will be the dynamic stability margin, and bifurcation point C or B(When C is in the lower part of the PV curve) may be the steady-state stability margin.
Basic pattern i) usually appear with three commonly used regulator when they are well tuned and the x and xd are not very big.when the regulator is not well tuned, the size of exciter is too small or the transmission line is too long, basic pattern ii) and iii) may appear).Basic pattern iii) usually appear with P- regulator (Efd0 is constant), even the transmission line is not very long and the exciter size is not too small. It is very similar with the analysis of when the steady-state analysis method is good enough or not (In page 5 and 6) In basic pattern i), the limit of field current determine that how much reactive power the generator can apply--Qmax; The limit of stator current determine that how much real power the generator can apply--Pmax; The Over-heating limitation of the stator core determine that how much reactive power the generator can absorb—Qs-max. But for pattern ii) and iii), things will be more complex, these maximum value may no longer be determined by the limitations of generator, they may be influenced by the regulator, exciter or the length of the transmission line.
Summary 1. We clarify the limitation of the steady-state analysis, point out the importance of the dynamic stability margin and how to get it. 2. We can unbundle the contribution of voltage stability to generator owners, transmission owners and voltage control owners based on our analysis. 3. We demonstrate that how the limits of the system and parameters of the system (generator and transmission) affect the bifurcation patterns and the stability margin. The knowledge will enable us to design the controller and optimize the system performance.