Download
1 / 33
330 likes | 466 Views
L. F. A. G. S. F ostering L earning, A chievement, and G raduation S uccess. Why ?. Needed a system to support campuses, schools, departments and other academic units throughout IU in igniting student retention and success Task force assembled in Oct. 2010

E N D
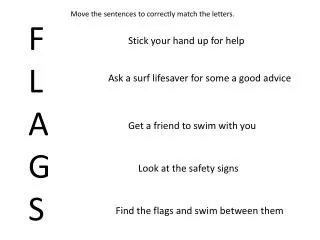
L F A G S Fostering Learning, Achievement, and Graduation Success
Why ? Needed a system to support campuses, schools, departments and other academic units throughout IU in igniting student retention and success • Task force assembled in Oct. 2010 • Reviewed 4 vended products to see “what’s out there” • Assembled information into “Big Picture” • Decided to build in-house …..which will take time • Rosters to collect classroom performance data • Learning Management System full of data to mine • Admissions data in our SIS • Reporting capability (both operational & Business Intelligence • Advising Notes system already on list for enhancement
The Big Picture! Pre & Post Admission 360◦ view Student Survey More 4 year graduates? Class Performance Roster Admission Data, Classroom Activity, Student Self-Assessment What interventions were most effective? Assessment / Effects on Retention Learning Management System Support Centers Student Notification, Scheduling, Action, Interaction Business Intelligence Reporting Schools Operational Advisors Registrar
Then…what happened? • Project “stalled” in light of other priorities • Presidential mandate • Available for faculty input by August 2011!! • “Quick’ deliverable ...then Four Phase project!
Why FLAGS? • Planning: • IU-FLAGS Advisory/Steering Group • Roster Team • Reporting Team • Advising Records Team • Analysis and Assessment Team
Phase I – Feb thru July 2011 • Student Performance Roster • Customize SIS roster to collect student classroom data • Uses a tool faculty already know • Operational Reporting • High level overview of FLAGS data • Mechanism to capture Requested Actions • Operational reporting • Attendance • Performance Concerns • Suggested Actions
Phase I (cont.) • Student Survey “Draft” • Study options for student survey content and delivery • Advising Records System • Begin draft of initial specifications
Phase II – August 2011-June 2012 • Student Performance Roster • Additional modifications as requested • More recommended student actions • Remove default values • Separating “Attendance” from “Flags” • Institution-specific recommended actions • Student Survey • More discussion brings concern • Operational Reporting • Additional mods based on changes to roster
Phase II – August 2011-June 2012 • Advising Records • Continued development • Reviewed Advising dashboard at Minnesota • Assessment • Identify and model data for pre- and post- admission risk assessment, develop reporting • Mine, model and report data from LMS (Oncourse) • Develop FLAGS dashboard integrating layers of data
Phase III – Now thru December • Student Performance Roster • Separate “attendance” from other indicators • DASHBOARD in the Learning Management System • Operational Reporting • Additional mods based on changes to roster • Advising Records System • Pilot Deployment
Phase IV – Through December 2012 • Assessment • Business Intelligence and Reporting • Identify and model data for pre- and post- admission risk assessment, develop reports • Mine, model and report data from LMS (Oncourse) • Develop FLAGS dashboard integrating layers of data
Future Development • Student Performance Roster • New enhancements to SIS priority list • Operational Reporting • Required maintenance mode • Advising Records System • Full Deployment…..or additional phase to completion • Assessment • Complete full dashboard/Business Intelligence
Student Performance Roster • Front-end data gathering tool
Student Performance Roster Attendance Recommended Actions Trends FLAGS
Student Performance Roster FLAGS Recommended Actions
Operational Reporting • Roster feedback to data warehouse • Visual summary and detail data • Utilize “new” tool – BIRT (Business Intelligence Reporting Tool) • Users able to export data as needed • Identify students that are currently at risk in a course or courses • Intervene to encourage students to take the “recommended actions”
Operational Reporting • Summary Dashboard Issues
Operational Reporting Actions Trends FLAGS Attendance Issues Clickable link to the Student Detail Rpt.
Operational Reporting IrregularAttendance
Operational Reporting BI Campus Dashboard
Operational Reporting Poor Quiz & Test Scores BI Campus Dashboard
Operational Reporting • Advisors – for just their students: Issues Clickable link to the Student Detail Rpt. Clickable link to the Student Schedule
Operational Reporting • Drill down to student with FLAGS: FLAGS LMSdata FLAGS
Operational Reporting • Academic Support View RecommendedAction
What have we done so far? • Attendance: • Over 1000 e-mail notifications to IUPUI students • Recommended Actions/Interventions • IUPUI Bepko Learning Center • 1,237 students • IUPUI Math Assistance Center • 1,731 students
What have we done so far? • Recommended Actions/Interventions • IU East – Retention Office • 695 students • IU Kokomo – Registrar & Advisor • 792 students Getting into the “swing” of things!
Where are we going now? • Learning Management System • What data can be used? Sorting through the data. • Integration to FLAGS • Faculty • Students • Advising Records System • Getting more involved in this part of project • Fully functional system with dashboard approach • Advisors and other “In-the-know” at all times!
Where are we going now? • University Assessment and Refinement • Pulling data from: Rosters, LMS, Advising Records System, Admissions, etc. • Analysis • Dashboard Display
Involve the right faculty groups from the beginning (don’t assume) • Our timeline made this difficult • Not doing it has caused some bad “PR” on initial rollout and inefficiencies • Could have driven immediate demand to our LMS Lessons Learned
Lessons Learned (cont.) • Be Involved from the starting line!!! • Registrar representatives from various campuses on various committees • Communication • “There can never be too much communication” • IUPUI vs IU-Bloomington • Owner on Campus should be the sender • Develop a thorough Project Plan • Document decisions made along the way and rationale
From Passive… To Active…. When it comes to our role in Student Success……
Who are we? Mary Beth Myers – mbmyers@iupui.edu Linda Hadley – lhadleyk@iupui.edu