Download
1 / 69
700 likes | 993 Views
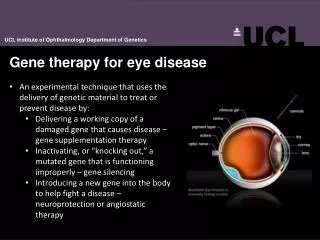
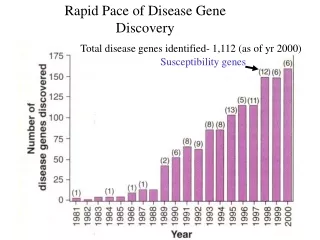
Disease and Gene Associations. North Carolina Genomics Symposium March 18, 2005. Elizabeth R. Hauser Duke University Center for Human Genetics. Breaking News- March 14, 2005. 3 Research Teams independently identify a gene for macular degeneration. Significance of AMD result.

E N D
Disease and Gene Associations North Carolina Genomics Symposium March 18, 2005 Elizabeth R. Hauser Duke University Center for Human Genetics
Breaking News- March 14, 2005 3 Research Teams independently identify a gene for macular degeneration
Significance of AMD result • Affects 1 in 5 people over age 65 • Complex disease • Clearly a genetic component • Important environmental risk (e.g. Smoking) • Multiple groups identified the same polymorphism • accounts for 20-50% of the overall risk in these studies • Each group used a slightly different approach • Genetic analysis was an important step • Started with linkage and proceeded to association • Human Genome Project provided key information
The CFH gene for Age-related Macular Degeneration is the most recent example of a gene for a common disease, whose identification was greatly enhanced by the Human Genome Project. These are exciting times in which to be doing research on genetic determinants of disease!
Outline • Types of genetic disease • Evidence for the involvement of genes • Study designs and analysis methods • Taking complexity into account • Coronary artery disease example
Simple vs complex disease • Disease definition=phenotype • Simple traits=> Easily defined • Complex traits=> Difficult to determine • How is the diagnosis made? • Measurements • Instruments • May be expensive to collect • There may be ambiguity in the definition of disease • Affected well defined, Unaffected ? • Coronary artery disease requires specialized procedures • Coronary catheterization • Stress tests • Clinical event, such as heart attack or bypass operation
- Environment - Genes Genes and Disease Environmental Diseases Monogenic Diseases Complex Diseases • Alzheimer disease • Cardiovascular Disease • Autism • Parkinson Disease • Influenza • Hepatitis • Measles • Huntington Disease • Spinocerebellar Ataxia • Spastic Paraplegia • Tuberous Sclerosis
Causative or Mendelian Gene Gene directly leads to disorder Recognizable inheritance patterns One gene per family Less common diseases Cystic fibrosis, muscular dystrophies Complex or Susceptibility Gene Gene confers an increased risk, but does not directly cause disorder No clear inheritance pattern Involves many genes or genes and environment Common in population cancer, heart disease, dementia
Defining what to study • As in any biomedical study, need to precisely define the disease under study • Define primary phenotype and secondary phenotypes • Validity and Reliability • Understanding risk factors • Genetic or Environmental? • Ethnic differences • Age/gender distribution • Use epidemiologic information to refine the phenotype definition • Consider comparability to other studies
Refining the phenotype-genes • Idea: Make the effect of certain genes in the sample more easily detectable • Genetic effects may be stronger for extremes of the risk factor distribution • restrict sample to people with onset at a very young or very old age • Genetic effects may be stronger for unusual presentations • restrict sample to individuals with coronary artery disease (CAD) without lipid abnormalities • restrict sample to diabetics with nephropathy
Refining the phenotype-environment • Minimize effect of known environmental confounders • restrict sample to nonsmokers • restrict sample to unmedicated people, e.g. in hypertension studies • Collect data in a genetically homogenous population such as a particular ethnic group or genetically isolated population • Reduce the number of genes contributing to the phenotype
Familial aggregation • Familial aggregation is the clustering of affected individuals within families. Documenting the familial aggregation is often the first step in characterizing the genetic basis for a trait. • Major questions to ask yourself: • Is there heterogeneity? • Is it possible that there is a Mendelian subset of families? • Oftentimes, Mendelian subsets of complex disease are characterized by early age of onset or increased severity.
Twin Studies • Purpose: Estimate the genetic component of • a disease or associated phenotype • Usually assume that twins share a common environment which lessens the impact of environmental influences (although this may not be true for studies of adult twins) • Usually compare twins of same sex (especially useful if there are known differences in disease frequency in males and females) • Twins are same age so age-dependency is not a problem
Twin Studies One twin is affected, how often is the other? Review article: Martin et al. “A twin-pronged attack on complex traits” Nature Genetics 17: 387-392 (1997).
Twin Studies: Adoption Comparison of disease frequency in adoptees with their biological vs. their adopted parents(or siblings). Given the adoptee is affected, what percent of parents have the disease? Biologic Adoptive Type of disease Suggests strong genetic85%5%component, frequency in adoptive parents may reflect risk in the general population Suggests strong environmental 5%85% component, frequency in biologic parent may reflect risk in general population
Segregation Analysis • Test the disease distribution in families for concordance with specific genetic transmission models • Very difficult studies to perform • Families need to be collected in a very precise way • Works best for single gene disorders • Not terribly successful for common diseases
I= recurrence rate in relative of proband rate in general population Recurrence Risk to Relatives:I A measure of how “genetic” a trait or disease is: What is the rate of affection for relative of proband with the disease vs. the frequency of the disease in the general population? where ‘I’ indicates the degree of relationship Risch N. Am J Hum Genet (1990): 46 pp. 222 - 253.
Recurrence Risk to Relatives:s • Values > 1.0 are generally taken to indicate evidence in favor of a genetic component. In general, the higher the value, the stronger the genetic component. • Values can be used to estimate the number of genes under different genetic models. • Note that the magnitude of the estimate is very dependent on the frequency in the population. For example, a common disorder may have frequency estimates of 3-6% depending on how a given study was performed but this results in small .
Recurrence Risk to Relatives:s s: Disease: Alzheimer 4-5 Neural tube defects 25-50 Obesity 1.8 Autism 100-150 Cystic fibrosis 1000
Best Proof of All? Connect genetic variation to the disease!
Locating a Variation 30,000 Genes on 46 chromosomes
Gene 1 Gene 2 Gene 3 Gene 4 Gene 5 Gene 6 Locating a Variation Region carrying the variation
Locating a Variation Variation found in gene
The process of recombination in meiosis creates a relationship between two genes that is a function of the distance between them.
Genetic Markers • In order to use recombination need to have genetic markers throughout the genome • Know where the markers are in the genome • Human Genome Project tells us precisely where the markers are • Unchanged from generation to generation • Follow transmission from parents to offspring • Be able to distinguish alleles • Polymorphic- having more than one state (alleles) • Can follow markers and alleles from one generation to the next
Observe Disease and Markers of Genes Passed Together from Parents to Children Aa aa
Observe Disease and Markers of Genes Passed Together from Parents to Children Aa aa Aa Aa aa Aa
Observe Disease and Markers of Genes Passed Together from Parents to Children Aa aa Aa aa Aa Aa aa Aa aa Aa aa Aa Aa aa Aa aa Aa aa
Observe Disease and Markers of Genes Passed Together from Parents to Children Aa aa aa aa Aa aa aa Aa Aa Aa aa aa Aa Aa aa aa Aa aa aa Aa aa aa aa aa Aa aa aa Aa Aa aa
Observe Disease and Markers of Genes Passed Together from Parents to Children Aa aa
Observe Disease and Markers of Genes Passed Together from Parents to Children Aa aa aa Aa Aa Aa
Observe Disease and Markers of Genes Passed Together from Parents to Children Aa aa Aa aa aa Aa aa aa Aa Aa Aa aa aa aa Aa aa Aa Aa
Observe Disease and Markers of Genes Passed Together from Parents to Children Aa aa aa aa Aa aa aa Aa Aa Aa aa Aa aa aa aa aa Aa aa Aa Aa aa aa aa aa Aa Aa aa Aa Aa Aa
The phenomenon of the co-transmission of disease and marker alleles within a given family is called LINKAGE.No recombination is taking place between the disease and marker suggesting that they are close together on the same chromosome.
Suppose that we see linkage and we can follow transmission of marker alleles from parents to offspring.Suppose that in comparing many families, all diseased people in all families get the A allele.Now we have ASSOCIATION too.
Allelic Association A B A B a b A B A B a b a b • Alleles A and B at two loci are associated if the event that a gamete carries A is not independent of the event that the gamete carries allele B. • Alleles are not associated if they occur together in the same gamete randomly. • Association is population-specific. a b A B A b A b a B a b A B
We can test for genetic association in families or in unrelated people.Many genetic association studies are performed as case control studies.Information is gained when we can combine evidence for genetic linkage with evidence for genetic association.
Coronary Artery Disease • Major cause of death and disability throughout the world • 12 million Americans have coronary artery disease • 7 million with myocardial infarctions • 6.2 million with angina pectoris • Well-defined risk factors: smoking, high cholesterol, physical inactivity, overweight, family history
What is the evidence that CAD is genetic? Family history is a strong risk factor.
Evidence for Genes in CAD • Familial aggregation • The clustering of affected individuals in families • Twin studies • If one twin is affected, the other twin is affected more often than by chance • A monozygous (identical) twin has higher risk than a dizygous twin (Marenberg et al. 1994) • Relative risk to co-twins is increased at young age • In old twins, rates are similar in MZ and DZ twins