
Comprehensive PCR/ESI-MS Detection of Vibrionaceae with Eight-Primer Panel
Explore a versatile assay panel for thorough Vibrionaceae detection. Primer sequences reveal species-specific markers, with detailed base composition analysis for species-level resolution.

Comprehensive PCR/ESI-MS Detection of Vibrionaceae with Eight-Primer Panel
E N D
Presentation Transcript
A B C Figure S1
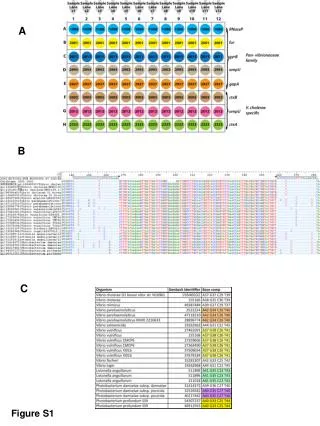
Figure S1. Vibrionaceae detection and characterization using PCR/ESI-MS. (A) An eight-primer assay panel with breadth of coverage across the entire family was designed. Three of the eight primer pairs shown in rows F-H were exclusive to V. cholerae species detection (ompU) and detection of the toxin genes, ctxA and ctxB. The remaining five primer pairs were expected to amplify most of the known species in this family and the resulting base compositions provide species-level resolution. (B) Multiple sequence alignment showing one of the broad primer pairs (2001-fur) used for the amplification of Vibrio species. Primer sequence is shown on top. Dots indicate conservation compared to this sequence. (C) Base composition analysis of the above sequences shows species-level differentiation. All entries were derived from GenBank. Identical base compositions are shaded in the same color.


