Download
1 / 14
140 likes | 361 Views
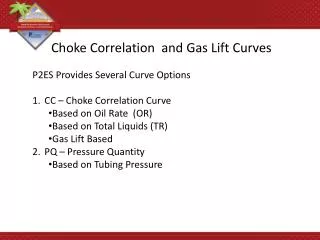
Choke Correlation and Gas Lift Curves. P2ES Provides Several Curve Options CC – Choke Correlation Curve Based on Oil Rate (OR) Based on Total Liquids (TR) Gas Lift Based PQ – Pressure Quantity Based on Tubing Pressure. Choke Correlation Curve.

E N D
Choke Correlation and Gas Lift Curves • P2ES Provides Several Curve Options • CC – Choke Correlation Curve • Based on Oil Rate (OR) • Based on Total Liquids (TR) • Gas Lift Based • PQ – Pressure Quantity • Based on Tubing Pressure
Choke Correlation Curve • R(fluid) = Rmax(fluid) * [1 - e-k(choke - c)] • Where: • R (fluid) = calculated fluid flow rate (sum of net oil and water measured in bbl/day or m3/day) • Rmax(fluid) = maximum fluid flow rate (bbl/day or m3/day) • k = decay constant derived by curve fitting process (typical values will be positive, but less than 1) • choke = wellhead choke position. In imperial units, this is a value measured in inches (x/64"). In metric units, this is a value measured in millimeters. • c = computed parameter (c has a value of 0.0 if the ‘Calc Offset’ check box is not checked)
Gas Lift Choke Correlation Curve • R(oil) = Rmax(oil) * [1 - e-k(gas lift rate - c)]- D*gas lift gas rate • Where: • R (oil) = calculated fluid flow rate (net oil and water measured in bbl/day or m3/day) • Rmax(oil) = maximum flow rate (bbl/day or m3/day) • k = decay constant derived by curve fitting process (typical values will be positive, but less than 1) • gas lift rate = gas flow rate from well tests or allocation (MSCF/day or KSM3/day) • c, D = computed parameters
Insert header here Text and images
Insert header here Text and images
Insert header here Text and images
Insert header here Text and images