Download
1 / 16
160 likes | 184 Views
Explore authoritative ocean conservation data and trends on Our Shared Seas website, supporting informed decisions in marine conservation. Access updated figures, charts, and insights to drive positive change.

E N D
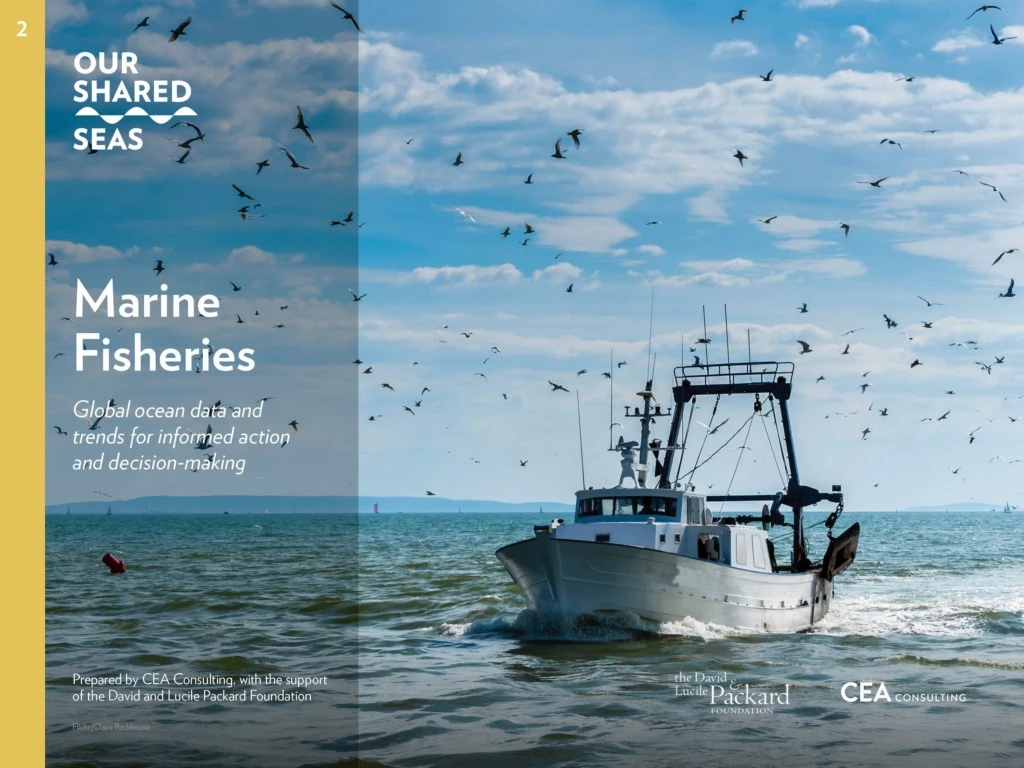
While it is often said that the world is awash in data, informed decision-making can occur only when data are transparent and readily available to the stakeholders that need the information. Our Shared Seas is a website platform which seeks to roll up relevant ocean conservation data in a centralized, easy-to-use platform, providing authoritative data and sensemaking of ocean trends. • The purpose of this project is to aggregate ocean statistics and trends to support the marine conservation community—including funders, advocates, practitioners, and policymakers—in making better, faster, and more informed decisions. In 2017, the David and Lucile Packard Foundation commissioned CEA Consulting to prepare Our Shared Seas: A 2017 Overview of Ocean Threats and Conservation Funding as a primer on the primary ocean threats, trends, and solutions. As a second edition of the original narrative report, the 2019 edition takes the form of a website is which provides updated figures and share key data points in a format that is easy to digest and use for external purposes. • Visitors are welcome to download both individual charts directly from the site and PowerPoint decks for external use, provided that corresponding references are cited. • This deck serves as a companion piece to the Our Shared Seas website. Readers are encouraged to visit the website for additional data and analysis at www.OurSharedSeas.com.
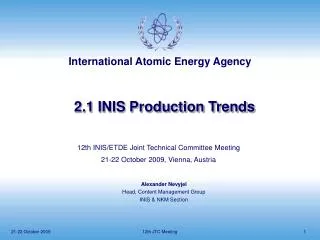
FAO reports that global landings were 93 million tons in 2016. Catch reconstructions place global landings roughly 30% higher than FAO’s officially reported figures. Fisheries : Global Production Trends Source: FAO Fisheries and Aquaculture Department, FishStatJ - Software for Fishery Statistical Time Series, 2018; Pauly D. and Zeller D., editors. Sea Around Us Concepts, Design and Data, www.seaaroundus.org, 2015; Meta data from: Watson, Reg A., and A. Tidd. “Mapping Nearly a Century and a Half of Global Marine Fishing: 1869–2015.” Marine Policy 93 (July 2018): 171–77. http://dx.doi.org/10.4226/77/5a65572655f73; http://data.imas.utas.edu.au/portal/search?uuid=ff1274e1-c0ab-411b-a8a2-5a12eb27f2c0 Statistics from FAO suggest landings have followed a roughly consistent level over the last 20 years. Catch reconstruction methodologies suggest that total global catch has been on a slight downward trajectory since the mid-1990s. Comparison of global marine capture estimates (1950-2016)
An estimated 20% of global fish catch, representing 11-26 million tonnes of landings is caught illegally, accounting for an annual economic loss of USD 10-23.5 billion. Fisheries : Global Production Trends Source: Meta data from: Watson, Reg A., and A. Tidd. “Mapping Nearly a Century and a Half of Global Marine Fishing: 1869–2015.” Marine Policy 93 (July 2018): 171–77. http://dx.doi.org/10.4226/77/5a65572655f73; http://data.imas.utas.edu.au/portal/ search?uuid=ff1274e1-c0ab-411b-a8a2-5a12eb27f2c0. Recent analysis by Watson and Tidd (2018) updated this figure, estimating that illegal and unreported fishing accounted for roughly 25% of landings in 2015 (32 MT). While these figures represent the best available global estimate, accurately determining the scale of IUU is a significant challenge, which is one reason for the wide confidence intervals. Estimates of unreported catch estimates (1950-2016)
As wild capture landings plateaued in recent decades, a major redistribution of catch has taken place between developed and developing economies. Fisheries: Global Production Trends Source: FAO Fisheries and Aquaculture Department, FishStatJ - Software for Fishery Statistical Time Series, 2018, http://www.fao.org/fishery/statistics/software/fishstatj/en. Total landings in developed countries, primarily in North America and Europe, declined by a third since the late 1980s. Meanwhile developing economies (including China, Peru, and Russia) have seen consistent increases in catch—from representing 40% of global catch in 1980 to 65% in 2016 Catch by country economic classification
Regionally, Asia has experienced the most notable expansion in catch, with a nine-fold increase in landings since the 1950s. Fisheries: Global Production Trends Source: FAO Fisheries and Aquaculture Department, FishStatJ - Software for Fishery Statistical Time Series, 2018, http://www.fao.org/fishery/statistics/software/fishstatj/en; Cao, Ling, Yong Chen, Shuanglin Dong, Arthur Hanson, Bo Huang, Duncan Leadbitter, David C. Little, et al. “Opportunity for Marine Fisheries Reform in China.” Proceedings of the National Academy of Sciences 114, no. 3 (January 17, 2017): 435–42. Since 2012, wild capture landings by Asian countries have exceeded landings by the rest of the world combined. Recent research suggests that the continued high productivity of some Asian fisheries is at least partly driven by heavy fishing pressure and speciation, the shift in ecosystem composition toward smaller, more productive species. Capture fisheries landings: Asia compared to the rest of the world
Official data from the FAO suggests that the status of global stocks is poor, ranking 33% of assessed major stocks as overfished in 2015. Fisheries: Global Stock Status Source: FAO, ed. The State of World Fisheries and Aquaculture 2018. Rome, 2018. FAO data indicate that the portion of overfished stocks has steadily expanded over time—from 10% of stocks in 1975 to 33% in 2015—but has slightly stabilized in recent years.13 Most stocks remain unassessed, and more than half of monitored fisheries are depleted to the point of yielding little or no catch. Global stock status according to FAO
Sea Around Us suggests that two-fifths of stocks (a slightly larger proportion than the FAO estimate) may be overfished or collapsed. Fisheries: Global Stock Status Source: Pauly D. and Zeller D., editors. Sea Around Us Concepts, Design and Data, www.seaaroundus.org, 2015. The Sea Around Us data, which considers both assessed and unassessed stocks, suggests that 40% of stocks were overexploited or collapsed in 2014, the most recent published year. Proportion of stocks by stock status
The Sea Around Us data suggest that the proportion of stocks undergoing rebuilding has increased slightly in recent years. Fisheries: Global Stock Status Source: Pauly D. and Zeller D., editors. Sea Around Us Concepts, Design and Data, www.seaaroundus.org, 2015. As of 2014, 7.4% of stocks were classified as rebuilding; 8.6% as developing; 37% as exploited; 30% as overexploited; and 17% as collapsed. Proportion of catch by stock status
The Fisheries Management Index (FMI), which uses expert surveys to rate management effectiveness, found substantial variation in management globally. Fisheries: Management and Governance Countries without values for 2016 (indicated with an asterisk [*]) were not included in the baseline analysis. Sources: Melnychuk, Michael C., E. Peterson, M. Elliott, and R. Hilborn. “Fisheries Management Impacts on Target Species Status.” Proceedings of the National Academy of Sciences 114, no. 1 (January 3, 2017): 178–83. https://doi.org/10.1073/pnas.1609915114; Melnychuk, M., C. Ashbrook, M. Pons, R. Hilborn. “Assessing the effectiveness and recent changes in fisheries management systems of 28 fishing nations with the Fisheries Management Index survey.” University of Washington. August 27, 2018. FMI scores continue to hold a strong positive correlation with GDP per capita and a negative correlation with capacity-enhancing subsidies. Between 2016 and 2018, there was relatively little change in the FMI scores of individual countries. Fisheries Management Index (2016 and 2018)
For some countries that subsidize their high-seas fishing fleet—including China, Taiwan, and Russia—the government subsidies far exceed fishing profits. Fisheries: Management and Governance Source: Sala, Enric, J. Mayorga, C. Costello, D. Kroodsma, M.L.D. Palomares, D. Pauly, R. Sumaila, and Dirk Zeller. “The Economics of Fishing the High Seas.” Science Advances 4, no. 6 (June 2018): eaat2504. https://doi.org/10.1126/sciadv.aat2504 This suggests that high-seas fishing, which accounts for 6% of global catch, would not be profitable at its current scale for these countries without subsidies.Unprofitable fisheries can be propped up by underreporting high-seas catch and by using unfair labor compensation (or no compensation), both of which contribute to IUU. Net economic benefits of high-seas fishing
Among the top 20 fishing countries, catches from the high seas and EEZs of other countries increased by more than 600% from 1950 to 2014. Fisheries: Management and Governance Source: Tickler, David, Jessica J. Meeuwig, Maria-Lourdes Palomares, Daniel Pauly, and Dirk Zeller. “Far from Home: Distance Patterns of Global Fishing Fleets.” Science Advances 4, no. 8 (August 2018): eaar3279. https://doi.org/10.1126/sciadv.aar3279. The practice of distant-water fishing, defined as fishing in areas far removed from a country’s domestic waters, has been dominated by a small number of countries in recent decades, particularly Taiwan, South Korea, Spain, and China. Trends in the distance traveled to fish (1950-2014) Mean distance to fishing grounds for the world’s 20 largest industrial fishing countries (by tonnage) grouped by expansion history: a) rapid and continuous expansion; b) expansion followed by retrenchment; and c) limited expansion.
Between 2012 and 2016, the number of FIPs and MSC-certified fisheries has grown steadily, while the volume of certified landings slightly decreased. Fisheries: Management and Governance Source: California Environmental Associates, “Progress toward sustainable seafood – by the numbers.” Prepared for the David and Lucile Packard Foundation, 2017. The certified share of global landings dipped from 25% in 2012 to 23% in 2015. Total landings by percent volume in FIPs and the MSC program (2012-2016)
Among wild capture production in 2016, Seafood Watch rated 1% of production as “Best Choice,” 3% as “Good Alternative,” and 5% as “Avoid.” Fisheries: Management and Governance The underlying production dataset is based on FAO landings, supplemented with NMFS data for U.S. fisheries and RFMO data for tuna fisheries. Production data is based on 2016 landings and includes forage fish/reduction fisheries. Ratings data shown here were last updated April 2019. Where there is overlap between Seafood Watch Ratings and eco-certified production, the volume of ratings was reduced by the amount of overlap to avoid double counting. For wild fisheries, eco-certified is classified as MSC certified, except for fisheries where the Risk Based Framework was used for Principle 1; additional information is available here. Source: Monterey Bay Aquarium Seafood Watch, Seafood Watch Ratings, data provided to CEA on April 16, 2019. The Monterey Bay Aquarium’s Seafood Watch ratings and eco-certifications have now been applied to about 20% of the total wild fisheries production. Seafood Watch Ratings and eco-certification for wild fisheries production (2016)
A new modeling analysis suggests that modern slavery is at high- to medium-risk of occurring in countries which account for 70% of global seafood production. Fisheries: Management and Governance Source: Tickler, D, Bryant, K, David, F, Forrest, J A, Gordon, E, Larsen, J J, Meeuwig, J, Oh, B, Pauly, D, Sumaila, U R and Zeller, D. “Common causes, shared solutions: The relationship between modern slavery and the race to fish.” [undergoing review for publication]. The analysis found that modern slavery in major fish-producing countries is driven primarily by a) national fisheries policy (i.e., a country’s management to build and often subsidize distant water fishing fleets), and b) wealth and institutional capacity (i.e., large-scale unreported fishing, limited governance and enforcement capabilities, and low productivity fisheries). Top 20 fishing countries categorized according to risk of modern slavery in fishing industry
The David and Lucile Packard Foundation is a private family foundation created in 1964 by David Packard (1912–1996), cofounder of the Hewlett-Packard Company, and Lucile Salter Packard (1914–1987). The Foundation provides grants to nonprofit organizations in the following program areas: Conservation and Science; Population and Reproductive Health; Children, Families, and Communities; and Local Grantmaking. The Foundation makes national and international grants and also has a special focus on the Northern California counties of San Benito, San Mateo, Santa Clara, Santa Cruz and Monterey. Today, the Packard Foundation’s ocean investments are focused in six countries and on a suite of global strategies that together offer great potential for accelerating positive change. Learn more at www.packard.org. Since 1984, California Environmental Associates (CEA) has supported the work of environmental foundations and nonprofits as well as sustainability-oriented businesses with in-depth research and analysis, program design and evaluation, and strategic planning. Learn more at www.ceaconsulting.com. Please use the following citation when referencing this project as a body of work: CEA Consulting. 2019. “Our Shared Seas: Global ocean data and trends for informed action and decision-making.”