Download
1 / 17
500 likes | 2.14k Views
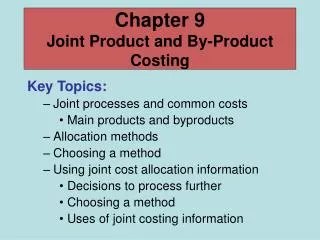
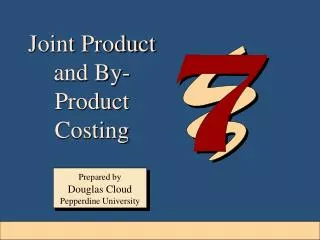
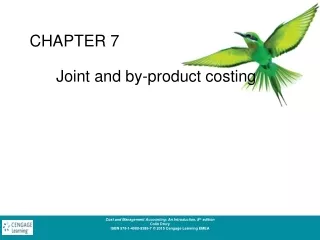
Joint Product and By-Product Costing. Joint Production Process. Pork Meat. Material: Hog. Processing. Hides. Split-Off Point. Joint Production Process. Joint products are two or more products produced simultaneously by the same process up to a “split-off” point.

E N D
Joint Production Process Pork Meat Material: Hog Processing Hides Split-Off Point
Joint Production Process Joint productsare two or more products produced simultaneously by the same process up to a “split-off” point. The split-off pointis the point at which the joint products become separate and identifiable. Separable costsare easily traced to individual products and offer no particular problem.
The distinction between joint and by-products rests solely on the relative importance of their sales value. A by-productis a secondary product recovered in the courseof manufacturing a primary product.
By-products can be characterized by their relationship to the main products in the following manner: • By-product resulting from scrap, trimmings, and so forth, of the main products in essentially nonjoint product types of undertakings (e.g., fabric trimmings from clothing pieces). • Scrap and other residue from essentially joint product types of processes (e.g., fat trimmed from beef carcasses). • A minor joint product situation (fruit skins and trimmings used as animal feed).
Examples of Joint Products and By-Products Industry Joint Products and By-Products Agriculture and Food Industries: Flour milling Patent flour, clear flour, bran, and wheat germ Extractive Industries: Copper mining Copper, gold, silver, and other metals Chemical Industries: Soap making Soap and glycerine Manufacturing: Cement Concrete pipe and aggregate See Exhibit 7-3 on page 251
Accounting For Joint Product Costs Benefits-Received Approaches • These methods are preferable whenever physical units are expressed in terms of heat content, volume or weight. Allocation Based on Relative Market Value • Relative Market Approaches are used whenever an individual joint product can absorb joint costs. • The assumption of this approach is that costs would not be incurred unless the jointly produced products (as a group) cover all costs and yield a profit.
Accounting For Joint Product Costs(see page 250) Benefits-Received Approaches (pages 251-253) • Physical Units Method • Weighted Average Method
Accounting For Joint Product Costs Physical Units Method A sawmill processes logs into four grades of lumber totaling 3,000,000 board feetas follows: Percent Joint Cost Grades Board Feet of Units Allocation First and second 450,000 0.15 $ 27,900 No. 1 common 1,200,000 0.40 74,400 No. 2 common 600,000 0.20 37,200 No. 3 common 750,000 0.25 46,500 Totals 3,000,000 $186,000
Accounting For Joint Product Costs Weighed Average Method A peach canning factory purchases $5,000 of peaches and grades and cans them by quality. The following data pertains to this operation: Number Weight Weighted No. Allocated Grades of Cases Factor * of Cases Percent Joint Cost Fancy 100 1.30 130 0.21667 $1,083 Choice 120 1.10 132 0.22000 1,100 Standard 303 1.00 303 0.50500 2,525 Pie 70 0.50 35 0.05833 292 Totals 600 $5,000 * Includes elements like amount of material used, difficulty to manufacture, time consumed, difference in type of labor used, and size of unit.
Accounting For Joint Product Costs Allocations Based on Relative Market Value • Sales-Value-at-Split-Off Method • Net Realizable Value Method • Constant Gross Margin Percentage Method • Sales-to-Production Ratio Method
Accounting For Joint Product Costs Sales-Value-at-Split-Off Method Using the lumber mill example from earlier-- Price at Actual Percent Quantity Split-Off Sales of Total Allocated Produced (per 1,000 Value at Market Joint Grades (board ft.) board ft.) Split-Off Value Cost First and second 450,000 $300 $135,000 0.2699 $ 50,201* No. 1 common 1,200,000 200 240,000 0.4799 89,261 No. 2 common 600,000 121 72,600 0.1452 27,007 No. 3 common 750,000 70 52,500 0.1050 19,530 Totals 3,000,000 $500,100 $185,999 ** *Total joint cost is $186,000. $186,000 X .2699 ( $135,000/$500,100) = $50,201 **Note: Does not add up to $186,000 due to a rounding error
Accounting For Joint Product Costs Net Realizable Value Method A company manufactures two products, Alpha and Beta, from a joint process. One production run costs $5,750 and results in 1,000 gallons of Alpha and 3,000 gallons of Beta. Neither product is salable at the split-off point, but must be further processed. The separable cost for Alpha is $1 per gallon and for Beta is $2 per gallon. minus Further = Hypothetical x = Hypothetical Allocated Market Processing Market Number Market Joint Price Cost Price of Units Value Cost* Alpha $5 $1 $4 1,000 $ 4,000 $2,300 Beta 4 2 2 3,000 6,000 3,450 $10,000 $5,750 * $4,000/$10,000 * $5,750 = $2,300
Accounting For Joint Product Costs Alpha Beta Eventual market value $ 5,000 $12,000 Less: Gross margin at 25% of market value 1,250 3,000 Cost of goods sold $ 3,750 $ 9,000 Less: Separable costs 1,000 6,000 Allocated joint costs $2,750 $ 3,000 Constant Gross Margin Percentage Method Calc. %age Revenue ($5 x 1,000) + ($4 x 3,000) $17,000 100 % Costs [$5,750 + ($1 x 1,000) + ($2 x 3,000)] 12,750 75 % Gross margin $ 4,250 25 %
Accounting For Joint Product Costs Sales-to-Production Ratio Method Sales-to- % of % of Production Calc. Costs Assigned Product Total Sales Production Ratio Percent Sales/Production A 10 10 1.0000 19.9338 % $ 199,338 B 20 15 1.3333 26.5778 % 265,778 C 15 25 0.6000 11.9603 % 119,603 D 40 30 1.3333 26.5778 % 265,778 E 15 200.750014.9504 % 149,504 100 100 5.0166 100.001 % $1,000,001 * *rounding error
Accounting for By-Product Costs By-product revenue also can be treated as a deduction from the cost of the main product. One possibility is to show net sales of by-products in the “Other Income” section of the income statement.
Effect of Joint Product Costs on Cost Control and Decision Making • It is important to understand when the use of allocated joint product costs may be misleading. • In making decisions relative to jointly produced articles, it must be remembered that the products are necessarily produced jointly. • Some areas that can be affected by joint cost allocationsare: • Output decisions • Further processing of joint products • Pricing jointly produced products