Download
1 / 11
110 likes | 214 Views
Applied Geothermics Aachen 0ct 4 2004. Numerical Simulation of a Thermal Response Test (TRT) Experiment. R. Wagner Applied Geophysics, Aachen University. Why run a Thermal Response Test?.

E N D
Applied Geothermics Aachen 0ct 4 2004 Numerical Simulation of a Thermal Response Test (TRT) Experiment R. Wagner Applied Geophysics, Aachen University
Why run a Thermal Response Test? The thermal power P of borehole Heat Exchangers (BHE) depends on Thermal Power P [kW] Production Temperature [°C] Thermal Power P [kW] Circulation Rate [m3 h-1] Thermal Conductivity [W m-1 K-1] • Circulation rate of BHE fluid • Fluid thermal properties • Injection and production temperature • Rock thermal properties • Rock hydraulic properties
TRT: Experimental Setup & Theory [Gehlin, 2002]
Constraints of The Line Source Approximation • Rock thermal capacity can not be calculated independently from data • The accuracy significantly depends critically on the length of the test interval • No lateral and vertical variation of physical parameters allowed • Experimental conditions (in particular Q) must remain constant • S. Signorelli, Geoscientific Investigations For The Use of ShallowLow-Enthalpy Systems, Dissertation, Swiss Federal Institute of Switzerland; Zürch, 2004
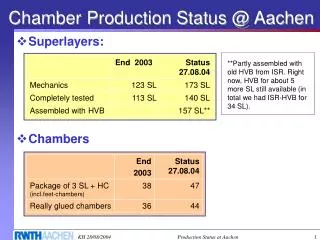
Groenholland BV Test Facility HDPE Concentric Heat Exchanger Length heat exchanger 40 m Outer pipe diameter 40 mm Wall thickness 3.7 mm Inner pipe diameter 25 mm Wall thickness 2.3 mm HDPE thermal conduct. 0.42 W m-1 K-1 Operation Time 106.67 h [Witte et al., 2002]
TRT Data from Heat Extraction Ground temperature 13.75 °C Flow 0.73 m3 h-1 Fluid heat capacity 3876 J kg-1 K-1 Fluid thermal conducivity 0.502 W m-1 K-1 Fluid Density 1026 kg m-3 Power -959.6 W
Brute Force: Numerical Simulation Simulation of BHE Experiment using highly resolved cylindrical FD grid C 4940 nodes Cell size 0.75mm … 2.5 m 1.000.000 timesteps t=0.38 s Courant criterion t=0.5 ms CPU time 30 h (SUN Enterprise 450) Seeking minimum misfitby variation of c and
Data evaluation: temperature residuals Temperature Residual R [K2] Thermal capacity c [MJ m-3 K-1] Groenholland testfacility accuracy Thermal conductivity [W m-1 K-1] R = (0.00280.0002) K2
Synthetic Data 2D FD Grid Constant heat extraction Q = -959,6 W at center node Heat Conduction only Simulation Time 106.67 d Temperature Residual R [K2] Thermal capacity c [MJ m-3 K-1] Thermal conductivity [W m-1 K-1]
Synthetic Data 2D FD Grid Varying heat extraction Q = -959.6 W ... +959.6 W at center node Heat Conduction only Simulation Time 106.67 d Temperature Residual R [K2] Thermal capacity c [MJ m-3 K-1] Thermal conductivity [W m-1 K-1]
Conclusion The evaluation of TRT experiments by means of numerical simulation of flow and heat transport yield no unique thermal rock properties Varying heat extraction/injection with time allows to calculate thermal rock properties - Problem: conventional evaluation (line source approximation) can not be applied any more Better forecast: Measurement of thermal rock properties and numerical simulation of BHE Acknowledgments Henk Witte, Groenholland BV Amsterdam