Download
1 / 7
70 likes | 92 Views
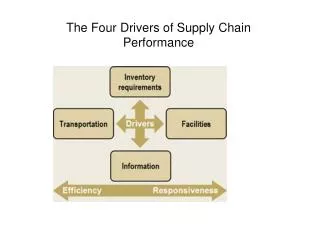
This analysis examines the factors that explain the decline in performance against the national four-hour standard in emergency departments (EDs). The findings show that performance has been declining over the past five years, with increased attendances, admissions, and bed occupancy being major contributing factors. Additionally, the study highlights the impact of population growth and demographic changes, particularly among older patients, on ED performance. Regional variations in ED performance are also noted. The analysis suggests that targeted initiatives, such as frailty assessment in EDs, can address the challenges faced by EDs in meeting the four-hour standard.

E N D
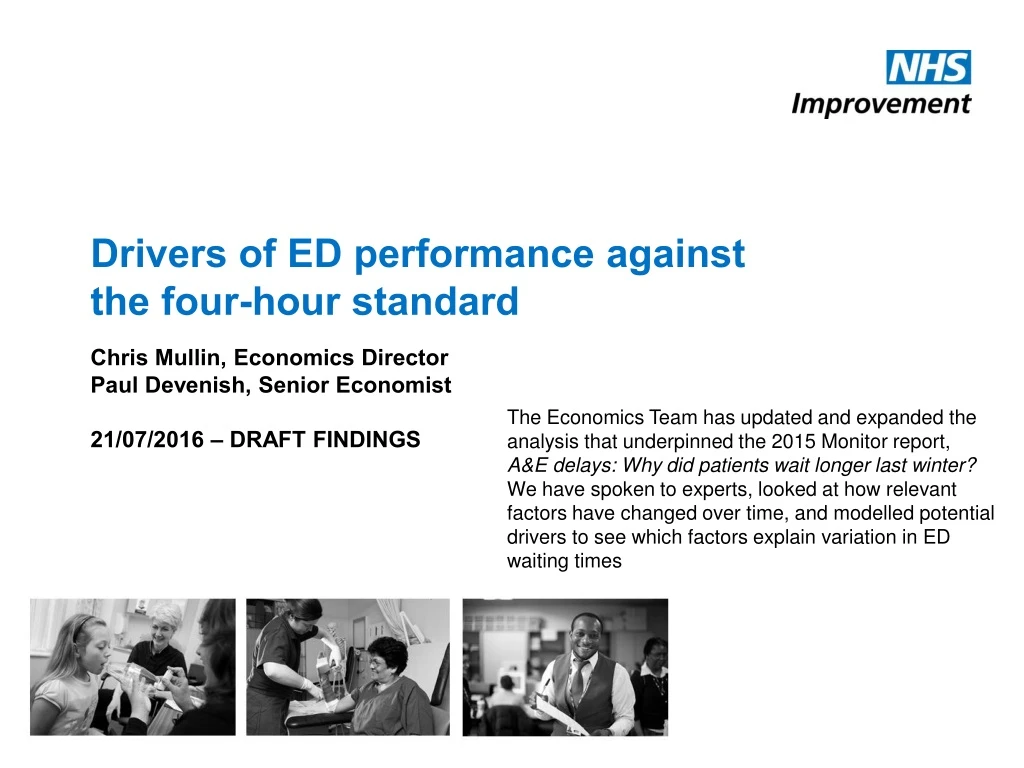
Drivers of ED performance against the four-hour standard Chris Mullin, Economics Director Paul Devenish, Senior Economist 21/07/2016 – DRAFT FINDINGS The Economics Team has updated and expanded the analysis that underpinned the 2015 Monitor report, A&E delays: Why did patients wait longer last winter?We have spoken to experts, looked at how relevant factors have changed over time, and modelled potential drivers to see which factors explain variation in ED waiting times
Performance against four-hour A&E standard has continued to decline • In winter 2015/16, performance against the national four-hour standard fell sharply and was missed for nearly 20% of patients. • This continued a five-year trend: between March 2011 and March 2016 performance against the standard fell 14 percentage points. • Attendances and admissions both increased over the same period. • In recent years, summer performance has dropped below the 95% threshold. With hospitals now already at capacity going into the winter, this may explain the increasingly deep winter troughs in performance. ED performance against target Emergency admissions ED attendances Elective admissions
Bed occupancy, driven by admissions, has grown by 3% since 2011. This is strongly linked to 4-hour waits • The NHS continues to face growing demand. Where previously sharp reductions in length of stay helped to offset growth in admissions, in recent years occupancy has climbed to very high levels. • In the last five years: • the number of general and acute beds has stayed broadly flat • hospitals have reduced length of stay by around 5% (this is less than previously but the NHS has a relatively low average length of stay by international standards) • emergency admissions have increased by 20%. • This high occupancy is most apparent in winter, when admissions peak. • Our regression analysis shows bed occupancy levels are strongly correlated with poor four-hour performance* • This backs up frontline observations that a lack of available beds slows the flow of patients out of A&E. Occupancy and its determinants Bed occupancy Emergency admissions Beds available Emergency admission length of stay * A&E departments appear to have coped well with processing higher attendances, which are not correlated with four-hour performance.
Older patients are 29% more likely to use ED than their predecessors just four years earlier Components of increase in ED attendances and admissions, 2010/11 to 2014/15 Population growth and age-mix effects Additional increase in use within cohorts • Changes in the size and age profile of the population account for about one fifth of the growth in ED attendances and admissions between 2010/11 and 2014/15. • Increased rates of utilisation by the older age groups are driving this greater-than-demographic growth in healthcare use. • While the rate at which an individual attends and is admitted through ED has increased across the population, this increase is greater in the older age groups. People over 75 are now 29% more likely to be admitted than their counterparts four years earlier. • In our econometric modelling, the proportion of attendances among people older than 80 is significantly related to poorer ED performance. • There are a number of plausible explanations: • It may be that older patients are on average more ill than previous cohorts, due to increased success in keeping people alive despite serious conditions. Such people may use ED more often. • It could also be that shortcomings in primary care and community care are leading to older patients using ED more. Attendances Admissions Change in chance of ED admission by age group, 2010/11 to 2014/15 Change for over 75s (between 2010/11 and 2014/15): +7% population +35% ED attendances +13% bed days +39% ED admissions
Growth in admissions varies significantly between GP practices Growth of emergency attendances and admissions (net of changes in list size) by number of GP practices 2010/11 to 2014/15 Across individual GP practices, we observe large variation in the increase in attendance rate, and even more variation for admissions. (This is after stripping out changes in list size). The rate of ED admissions has grown by over 25% in 29% of GP practices between 2010/11 and 2014/15. The variability is not visible at standard aggregated levels (CCG, STP area). This suggests that primary care may be contributing to ED pressures in specific local health economies, and points to potential for further analysis.
Each region faces different issues which contribute to their ED performance Regional summary for 2015/16 (in brackets: % change 2014/15 to 2015/16) North of England Midlands and East South of England London
Emerging conclusions • Our analysis suggests that the national A&E improvement plan targets the right areas: • front-door initiatives, such as frailty assessment in EDs, can help address the challenge of growth in admissions among older age cohorts • hospital flow initiatives remain key to tackling performance against the four-hour waiting standard, by reducing length of stay • tackling delayed discharge – whether to patients’ own homes, other NHS organisations or social care – will help to free beds for emergency admissions, reducing pressures in EDs, which can often manifest in poor patient experience (eg trolley waits) and lower staff morale as well as increased waits. • In addition, the evidence of variation between GP practices in ED admissions growth points to scope for further work to: • understand the underlying causes of that variation • support GP practices in some local health economies in tackling the growth in ED admissions. • A potential next step would be to discuss with NHS England how best to take this forward. • Changes in primary and community care may also help tackle the increased use of EDs across the population, particularly by older cohorts. We intend to do work to further understand the drivers of increased attendances.