Download
1 / 15
150 likes | 171 Views
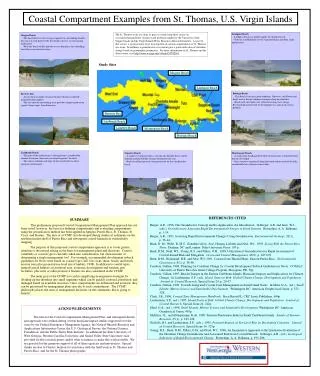
Comprehensive analysis of coastal data over the past 30 years, covering various aspects such as river conditions, reef health, fish capture, and habitat measures.

E N D
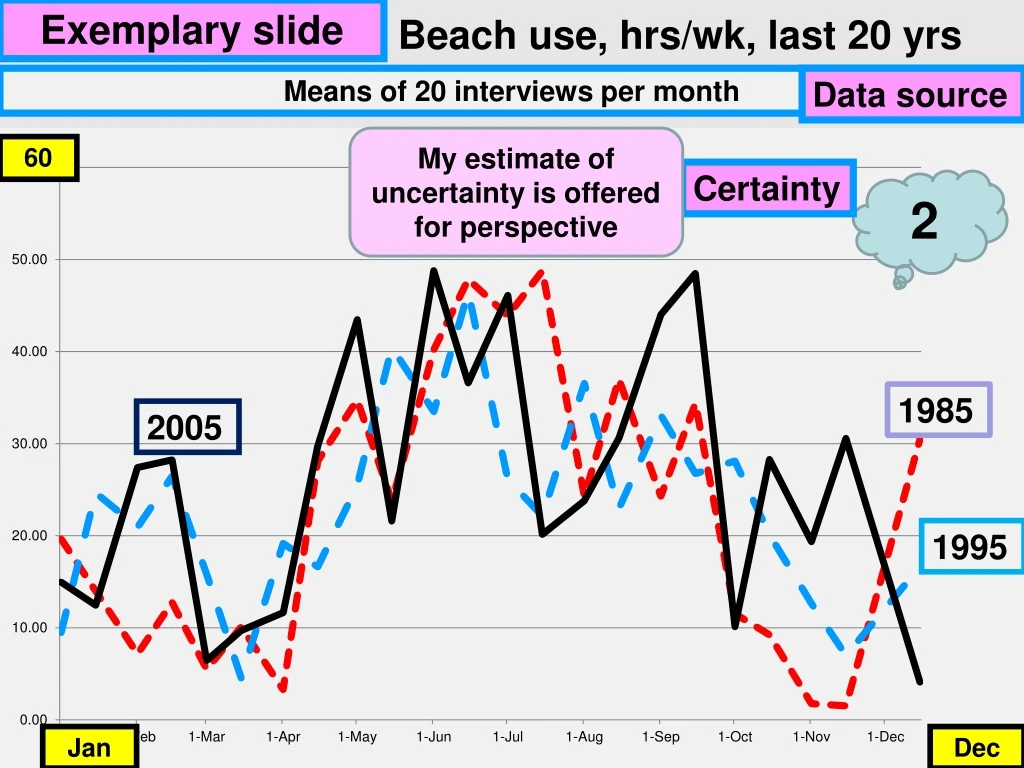
Exemplary slide Beach use, hrs/wk, last 20 yrs Means of 20 interviews per month Data source My estimate of uncertainty is offered for perspective 60 Certainty 2 1985 2005 1995 Jan Dec
Left & right bank riparian condition by river km; mean of 3 years, optimal =50 45 3.5 0 30 River km
Reef fish capture, kg/yr, last 30 yrs 1400 kg 3 1980 2009
4.5 Stream chemistry River km River km Water chemistry as mean of last 5 years. Stations are every 5 km; all variables normalized to most upstream condition, so first point is always 100%. River km River km
Reef health over last 5 yrs; best is 100 Nine, 50 m transects, perpendicular to shore 100 4.5 Shore 50 m
Calabash river fish over last 5 yrs Electrofishing data; fish diversity in 10 m reach by river Km 7.00 3 1980 2009 2000 20 km Mouth
Wetland ecology over last 30 years Mean of four transects per year 6.00 2 1980 2009
Stream habitat over last 20 yrs Mean of three Habitat Measures per year, per site; 50 is optimal 4.5 1995 2005 1985 20 km River km Mouth
Reef sedimentation rates over 25 yrs Mean of 100 measures per site per year, as % of reef covered. Transects run downstream from the Wagwater River. 1995 3 2005 1990 2009 2000 0 (Wagwater) 5 km
Calabash river invertebrate diversity over 30 yrs Benthic diversity in 1 m2 plots by river KM 7.00 5 2009 1990 1980 2000 20 River km 0
Marine chemistry over last 10 yrs 2 year intervals; monthly grab samples 10 m off the center of the beach 4 2008 1998 1998 2008 1998 2008 1998 2008
Stream discharge, cms, last 5 yrs Mean of 5 years, bi weekly samples 4.5 5 1 Dec 1 Jan
Reservoir chemistry over last 5 yrs 5-yr mean of monthly grab samples from the dam Turbidity 4.5 DO Nitrate Ortho P Jan Dec
Fishing pressure, hrs/mo over 20 yrs Means of 20 interviews per month 90 1.5 1985 1995 2005 Jan Dec
Fishing success, kg/10 hrs, over last 20 yrs Means of 20 interviews per month 120 1 1985 1995 2005 Jan Dec