Download
1 / 19
190 likes | 297 Views
Learn how to calculate probabilities in binomial settings with examples and practical applications in various scenarios.

E N D
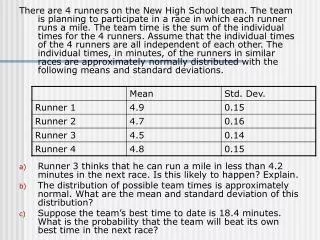
There are 4 runners on the New High School team. The team is planning to participate in a race in which each runner runs a mile. The team time is the sum of the individual times for the 4 runners. Assume that the individual times of the 4 runners are all independent of each other. The individual times, in minutes, of the runners in similar races are approximately normally distributed with the following means and standard deviations. • Runner 3 thinks that he can run a mile in less than 4.2 minutes in the next race. Is this likely to happen? Explain. • The distribution of possible team times is approximately normal. What are the mean and standard deviation of this distribution? • Suppose the team’s best time to date is 18.4 minutes. What is the probability that the team will beat its own best time in the next race?
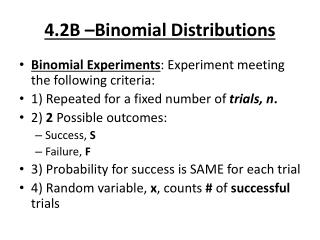
2NIP 2 outcomes: each observation can be categorized as a “success” or “failure” N: Fixed # of observations I: Observations are independent P: The probability is the same for each observation Examples: Coin toss to see which of the 2 football teams gets the choice of kicking off or receiving to begin the game A couple prepares for their first child
EX 8.1 • If both parents carry genes for the O and A blood types, each child has probability = .25 of getting two 0 genes resulting in blood type 0. Assume independence. • A “success” is the number of 0 blood types among 5 children of these parents in 5 independent observations. • Is this a binomial distribution?
Ex 8.2 • You are dealt 10 cards from a shuffled deck and wish to count the number X of red cards as you go through the deck. • A “success” is a red card. • Is this a binomial distribution?
What this means: Although sometimes a problem is not strictly independent and therefore not a binomial setting, the situation is close enough for practical purposes.
An engineer selects an SRS of 10 switches from a large shipment for detailed inspection. Unknown to the engineer, 10% of them fail to meet the specifications. What is the probability that no more than 1 of the 10 switches in the sample fail inspection? (Note: Assuming that a defective switch is drawn first (p=0.1), the probability for the second switch being defective changes to p=0.0999. For practical purposes, this behaves like a binomial setting even if the condition of independence does not strictly hold). Example 8.3
Ex. 8.6: The number X of switches that fail inspection in Example 8.3 has approximately the binomial distribution with n = 10 and p = .1. Find the probability that no more than 1 switch fails.
Calculator • We want to calculate when X is B(10, .1) • P(X 1) = P(X=0)+P(X=1) • TI-83: the function binompdf(n,p,x) calculates this P(X=0): Binompdf(10,.1,0) = .3486784401 P(X=1): Binompdf(10, .1, 1) = .387420489 P(X=0)+P(X=1) = .3487 + .3874 = .7361
PDF • Given a discrete random variable X, the probability distribution function assigns a probability to each value of X. The probabilities must satisfy the rules for probabilities given in chapter 6. • B(5, .25) distribution where n=5 children
PDF by calculator • How we arrived at the probability distribution function for B(5, .25) distribution where n=5 children • Binompdf(5, .25, 0), Binompdf(5, .25, 1)….Binompdf(5, .25,5)
Alternative Calculation/shortcut! CDF • Given a random variable X, the cumulative distribution function of X calculates the sum of the probabilities for 0, 1, 2…up to the value of X. • I.e., it calculates the probability of obtaining at most X successes in n trials. • For last example: P(X 1) = binomcdf(10, .1, 1) = .736098903 (same answer, less work)
Example 8.8 • Corinne is a basketball player who makes 75% of her free throws. In one game, she shoots 12 free throws and makes only 7 of them. Find the probability of making a basket on at most 7 free throws. • Check Binomial Settings (Use binompdf(n,p,X)) • P(X 7) = P(X=0)+P(X=1)+P(X=2)….+P(X=7) = .0000+.0000+.0004+.0024+.0115+.0401+.1032 = .1576 Same answer, less work: P(X 7) = binomcdf(12, .75, 7) = .1576436761
2 ways, same answer Example: Each child born to a set of parents has probability .25 of having blood type O. If these parents have 5 kids, what is the probability that exactly 2 of them have type O blood? • Binomial with n = 5 tries and p = .25. Find P(X = 2), where S=success=.25 and F=fail=.75 1st way: List all 10 possible outcomes: SSFFF, SFSFF, SFFSF, SFFFS, FSSFF, FSFSF, FSFFS, FFSSF, FFSFS, FFFSS, each with the same probability (for ex, the 1st: SSFFF = (.25)(.25)(.75)(.75)(.75)) P(X=2) = 2nd way: Using the binomial formula!
The binomial distribution is a special case of a probability distribution for a discrete random variable. • It is therefore possible to find the mean and standard deviation of a binomial in the same way as we did for a discrete random variable – but you really don’t want to. • Ex: If n=25, there are 26 values and 26 probabilities.
Ex 8.11 • The count X of bad switches is binomial with n =10 and p=.1. Find the mean and standard deviation:
Ex. 8.12: Shopping • Sample surveys show that fewer people enjoy shopping than in the past. A survey asked a nationwide random sample of 2500 adults if they agreed or disagreed that “I like buying new clothes, but shopping is often frustrating and time-consuming.” Population: all U.S. residents 18+. Suppose 60% of all adult U.S. residents “agree.” What is the probability that 1520 or more of the sample agree?
Binomial distributions often arise in discrimination cases when the population in question is large. The generic question is “If the selection were made at random from the entire population, what is the probability that the number of members of a protected class hired/promoted/laid off would be as small/large as it actually was?” This assumes that all members of the qualified population have equal merit, so its just a first step. If the population is large, we can act as if the candidates are chosen independently. • In 2004, the National Institute of Health announced that it would give a few new Director Pioneer Awards for research. The awards were highly valued: $500,000 per year for five years for research support. Nine awards were made, all to men. This caused an outcry. • There were 1300 nominees for the award, 80% male. Suppose that all nominees are equally qualified. If we choose 9 at random, the number of women among the winners has (to a close approximation) the binomial distribution with n=9 and p=0.2. Call the number of women X. • Find P(no award go to women), P(at least one woman), P(no more than one woman), the mean number of women in repeated random drawing, and the standard deviation. Can we use the normal approximation to calculate these probabilities?