Download
1 / 1
10 likes | 148 Views
Surface Temperature Distribution Measurement with Imaging Cameras. Elvin Ip, Hong Lu, Justin Scott, Larry Baxter. ACERC, Chemical Engineering Department, Brigham Young University, Provo Utah. Problems of Imaging Cameras

E N D
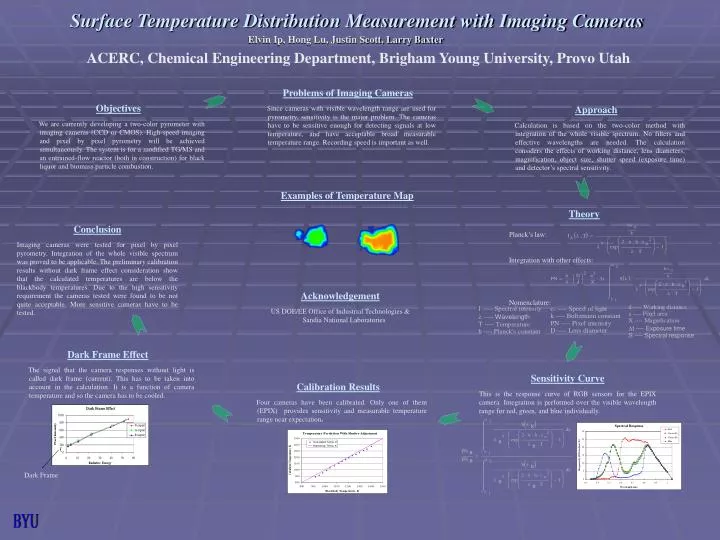
Surface Temperature Distribution Measurement with Imaging Cameras Elvin Ip, Hong Lu, Justin Scott, Larry Baxter ACERC, Chemical Engineering Department, Brigham Young University, Provo Utah Problems of Imaging Cameras Since cameras with visible wavelength range are used for pyrometry, sensitivity is the major problem. The cameras have to be sensitive enough for detecting signals at low temperature, and have acceptable broad measurable temperature range. Recording speed is important as well. Objectives We are currently developing a two-color pyrometer with imaging cameras (CCD or CMOS). High-speed imaging and pixel by pixel pyrometry will be achieved simultaneously. The system is for a modified TG/MS and an entrained-flow reactor (both in construction) for black liquor and biomass particle combustion. Approach Calculation is based on the two-color method with integration of the whole visible spectrum. No filters and effective wavelengths are needed. The calculation considers the effects of working distance, lens diameters, magnification, object size, shutter speed (exposure time) and detector’s spectral sensitivity. Examples of Temperature Map Theory Planck’s law: Integration with other effects: Nomenclature: Conclusion Imaging cameras were tested for pixel by pixel pyrometry. Integration of the whole visible spectrum was proved to be applicable. The preliminary calibration results without dark frame effect consideration show that the calculated temperatures are below the blackbody temperatures. Due to the high sensitivity requirement the cameras tested were found to be not quite acceptable. More sensitive cameras have to be tested. Acknowledgement US DOE/EE Office of Industrial Technologies & Sandia National Laboratories Dark Frame Effect The signal that the camera responses without light is called dark frame (current). This has to be taken into account in the calculation. It is a function of camera temperature and so the camera has to be cooled. Sensitivity Curve This is the response curve of RGB sensors for the EPIX camera. Integration is performed over the visible wavelength range for red, green, and blue individually. Calibration Results Four cameras have been calibrated. Only one of them (EPIX) provides sensitivity and measurable temperature range near expectation. Dark Frame BYU