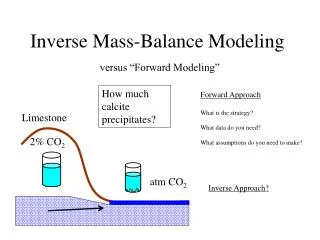
Inverse modeling
Inverse modeling. Semi-analytical algorithms : sensitivity analysis of the values of the backscattering spectral dependency n and the a_nap&cdom slope S on two stations Ma é va DORON, Ocean Optics 2004. To begin with. Roesler and Perry ’95 model of inverse modeling

Inverse modeling
E N D
Presentation Transcript
Inverse modeling Semi-analytical algorithms : sensitivity analysis of the values of the backscattering spectral dependency n and the a_nap&cdom slope S on two stations Maéva DORON, Ocean Optics 2004
To begin with • Roesler and Perry ’95 model of inverse modeling • 3 basis vectors in input: • spectral slope of the absorption of NAP and CDOM S (DL); • spectral slope of backscattering n in nm-1; • spectral absorption of chlorophyll (normalized). • 3 parameters in output : • chl in mg.m-3; • a_cdom&nap (440nm) in m-1; • bb(440nm) in m-1. • Data from the second cruise: one station off the DMC dock and one station near the ocean.
Goal • First idea • Comparison of the data retrieved by the GSM model and the R&P95 model (hyperspectral & multispectral at 412, 442, 490, 510 and 555 nm); • Sensitivity to S and n to the retrieved values • Comparison of the sensitivities for the hyperspectral and the multispectral model
Sensitivity • One spectral dependency n ,instead of 0 for large particles and 1 for small particles. • Varying the n – values : from 0 to 2. • Change the values of S : from 0.005 to 0.04 nm-1 : Realistic range of Scdom = 0.007–0.013nm-1 Realistic range of Snap = 0.016–0.022nm-1
Sensitivity for the S(cdom&nap) slope – multispectral- different scales
Discussion • This was a first qualitative approach. • The results are encouraging because for realistic values of S are not erratic. • Any idea about how to test the robustness of the algorithm with multispectral data?