Download
1 / 18
180 likes | 319 Views
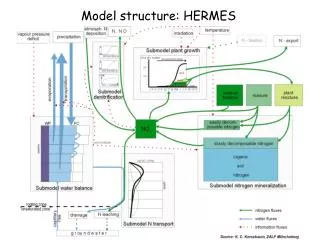
The ECN model structure for energy projections. Ton van Dril ECN Policy Studies vandril@ecn.nl UNFCCC Workshop on Emissions Projections Bonn 6-8 september 2004. Modeling specific developments in energy consumption on the technology level ( ottom-up). B. The technological bypass.

E N D
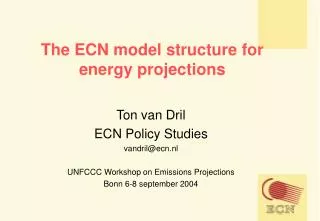
The ECN model structure for energy projections Ton van Dril ECN Policy Studies vandril@ecn.nl UNFCCC Workshop on Emissions Projections Bonn 6-8 september 2004
Modeling specific developments in energy consumption on the technology level( ottom-up) B
The technological bypass Statististics: Outlook for energy, Energy Expectations on economic, structural and policy developments Physical production Physical data Value added Value added Reconstruction of General sectoral characteristics, Outlook for energy functions and technology penetration energyfunctions, Model system and technology Production capacity Proces and technology data Expectations on Energy functions and technologies
Demand model inputs • Sectoral economic inputs: • CPB Athena or macro data > ECN sector model • Energy prices: - world markets for fuels, CO2 • feedback from supply model for electricity • Physical capacity and material flows: -ECN process capacity data, Stream model on 5 major physical substances • Technologies: -Households gas and power use surveys, UU Icarus4 database, buildings and horticulture data (ECN, LEI) • Implementation characteristics: -Expert judgements • Policies: -policy model
Supply model inputs • Existing capacity, installation level • Fuel prices • CO2 price and CO2 costs pass-through • Operational characteristics, mark-ups and liberalisation/market power, cross-border supply characteristics, etc.
Technology implementation characteristics 2 implementation 120% Capital 100% replacement 80% limitations 60% 1/Lplant 1/Lold 40% period 20% 0% 1 3 5 7 9 11 13 15 17 19 21 23 Lold: Lifetime of the old equipment Lplant: Lifetime of the equipment surroundings
Options penetration process, year t Evaluation of IRR, competing options Potential options shares • Total capacity increase + • Replacement of reference technology + • Replacement of older options • (lifetime not influenced by taxes, etc) Available capacity for options Max capacity per option Limitations for separate options Options division, year t
policy makers have to identify: desired physical changes decision makers and their scope occurences of decision Policy model step 1
policies have to create: attention (awareness) possibilities (technical, legal) advantage (financial, avoid sanctions) >>effective policies meet all three conditions Policy model step 2
attention policies: information campaigns, building regulations, environmental permits, covenants >often taken for granted possibility policies: R&D, demonstration, audits, company plans >options, replacement rate and implementation characteristics advantage policies: taxes, subsidies, regulation and sanctions, emission markets >IRR evaluation Policy model step 3
Strenghts and weaknesses • Looking ahead for new trends or limitations • Limited data set of options requires filling the blanks • No feedback of energy costs on sector growth • Data requirements and validation • Awareness and information costs
Multi layer approach: select processes first, then energy options, then short term behavior, then on-site supply options Demand sector growth depending on climate policies: emissions trading Awareness and information costs Multi criteria + limited options Further ideas for improvement
Further ideas for improvement • Consistency in energy and CO2 prices • Consistency in international economic developments • Consistency of improvements on global technologies • Consistency in EU policy perspectives • Consistency in uncertainties regarding the previous bullits
Research suggestions • Projection comparisons using the demonstrated methods • Divide tasks among research groups/countries • Analyse and compare policy impacts
Tabellen set RIVM MONIT 1. Duurzaam 6. SERUM 10. SELPE 8. SAVE-Industry CHP 7. SAVE-services 5. SAVE-HH 4. Tarieven 9. Powers 2. Transport Excel/GAMS 3. Gaswinning Excel dataconversie GAMS AIMMS Excel/Vensim AIMMS dataconversie Excel 11. Monit, PIE conversie 12. SpecialFuels