Download
1 / 36
360 likes | 505 Views
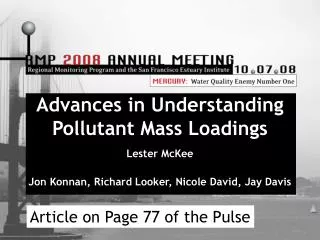
Advances in Understanding Pollutant Mass Loadings. Lester McKee Jon Konnan, Richard Looker, Nicole David, Jay Davis. Article on Page 77 of the Pulse. Why Measure Loadings?. Fish consumption advisories since 1993 San Francisco Bay is listed as impaired for a range of contaminants

E N D
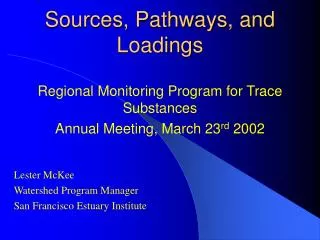
Advances in Understanding Pollutant Mass Loadings Lester McKee Jon Konnan, Richard Looker, Nicole David, Jay Davis Article on Page 77 of the Pulse
Why Measure Loadings? • Fish consumption advisories since 1993 • San Francisco Bay is listed as impaired for a range of contaminants • Initially loadings information was generated to develop TMDL project reports written by the Water Board • More loadings information • Measurement of progress towards targets
What are the Main Sources and Pathways? In-Bay contaminated sites Urban Stormwater Guadalupe River Focus is on the larger pathways that are deemed potentially controllable
What Stormwater Loading Studies are ongoing? • Sacramento River • Guadalupe River • Zone 4 Line A
Loadings per year - Sediment Journal of Hydrology: McKee et al., 2006 Mean = 1 million metric t
Loadings per year – Mercury ET&C: David et al., in review Mean = 210 kg
Loadings per year - PCBs Mean = 9.6 kg
PCBs on Particles Urban stormwater Non-urban stormwater
Loadings per year - Sediment Mean = 14,000 metric t
Loadings per year - Mercury Mean = 130 kg Methylmercury <<1%
Loadings per year - PCBs Mean = 0.9 kg PBDEs = 2.5x greater
Remaining Questions and Progress Mercury • Which watersheds are most contaminated? • What are the loadings from specific watersheds and the region as a whole • Currently based on sediment Hg concentrations and out-dated estimates of regional sediment loads • Little information on mercury speciation • Methylmercury • Reactive mercury
Remaining Questions and Progress PCBs • Little information on loadings from small heavily industrialized watersheds • Mainly near the Bay margin • Focus on “old industrial” • Which watersheds are most contaminated? • What are the sources and processes of release?
Remaining Questions and Progress • PBDEs and OC pesticides • One box model paper published in Environment International (Oram et al 2008) • Penta and Octa banned – when will the loads go down - will the Bay recover? • Dioxins and pyrethroid pesticides • No information on urban loadings • Little to no information on other pathways • Selenium, Copper, Nickel, PAHs • Not recently discussed
What are the remaining questions? All contaminants • Are there “high leverage” areas or processes on the Bay margin where contaminants impact the base of the food web • What is the linkage between watershed loadings and “hotspots” or “high leverage” areas on the Bay margin
Planning efforts to prioritize and address data gaps • Small Tributaries Loadings Strategy • Being developed now • Mercury Strategy (page 4 of the Pulse) • First strategy to be developed • Dioxin Strategy • Priorities vary by stakeholder – very expensive so still debate over funding • Modeling Strategy • Being developed now
Small Tributaries Loading Strategy 1) Impairment • Which are the “high-leverage” small tributaries that contribute most to Bay impairment? 2) Loading • What are the concentrations and average annual loads of pollutants of concern from small tributaries? 3) Trends • How are concentrations or loads of pollutants of concern from small tributaries changing on a decadal scale? 4) Support for Management Actions • What are the projected impacts of management actions and where should management actions be implemented? • A three page document that includes: • Key questions and priorities • Guiding principles • A timeline • Recommended methods
Summary • Our understanding of pollutant mass loads has changed considerably • We now have accurate measurements of loads in three watersheds • But there are still many questions • Through time the needs for information are becoming more explicit and the RMP is adapting to new needs • Constant re-evaluation of the management questions • 5-year plans for the workgroups and the program as a whole • Focus strategy documents (contaminant or issue specific)
Mercury labs MLML UCSC Brooks Rand Trace organics lab : AXYS Sediment studies USGS USDA RiverMetrics Field staff SFEI UCSC Water Board Acknowledgements