Download
1 / 36
360 likes | 372 Views
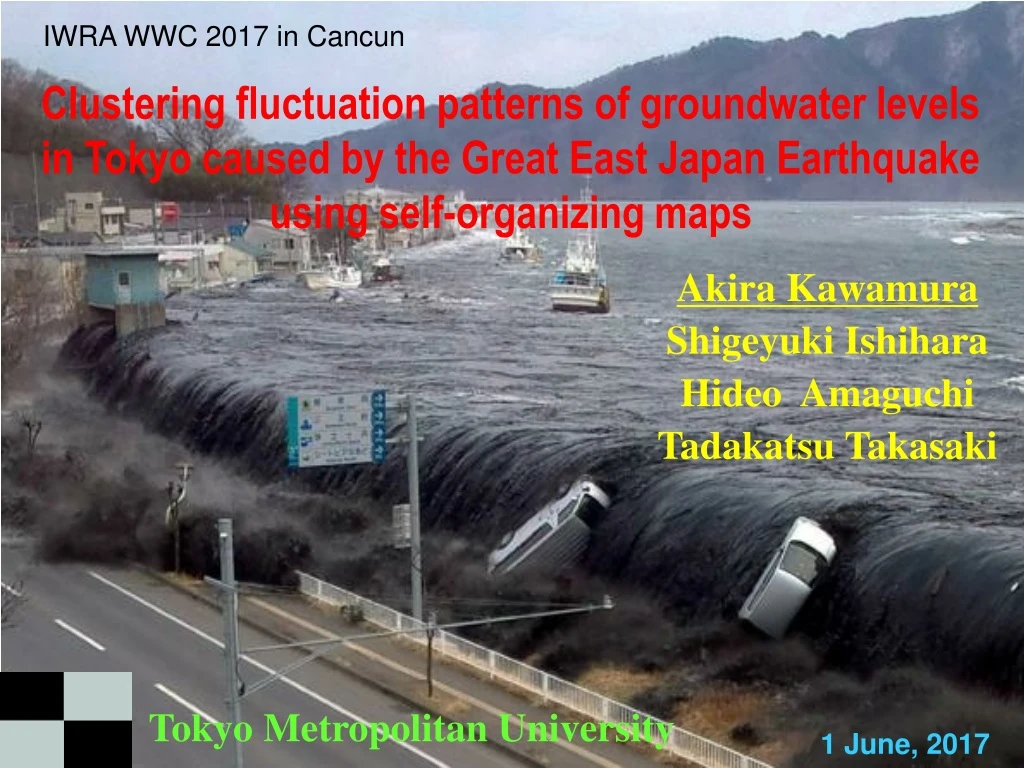
IWRA WWC 2017 in Cancun. Clustering fluctuation patterns of groundwater levels in Tokyo caused by the Great East Japan Earthquake using self-organizing maps. Akira Kawamura Shigeyuki Ishihara Hideo Amaguchi Tadakatsu Takasaki. Tokyo Metropolitan University. 1 June, 2017. Contents.

E N D
IWRA WWC 2017 in Cancun Clustering fluctuation patterns of groundwater levels in Tokyo caused by the Great East Japan Earthquake using self-organizing maps Akira Kawamura Shigeyuki Ishihara Hideo Amaguchi Tadakatsu Takasaki Tokyo Metropolitan University 1 June, 2017
Contents • Backgroundand Objective 2. Groundwater Monitoring Network in Tokyo and Data Used • 3. Clustering Method • using Self-Organizing Maps (SOM) 4. Identified Fluctuation Patterns and Discuss Their Causes 5. Conclusions
Location of Tokyo Tokyo, Japan 12,000km Cancun
Tokyo Metropolis Third smallest prefecture (2188km2) out of 47 (1/23 of Quintana Roo) The largest population (13.2 million) (8.8 times larger than Quintana Roo) The highest population density (6000/km2) 1/10 of whole National Budget
Distribution of Earthquakes (Mw>5) Whole Japanese Archipelago is in serious peril of severe earthquakes, because it is situated in the Circum-Pacific Seismic Zone.
Background • Most of the megacities not only in Japan but also Southeast Asian countries are located on the alluvial plains where the ground is very soft and especially vulnerable for groundwater related disasters. • Since groundwater is a crucial water resource for most of the cities around the world, it is very important to understand and evaluate the impact of a huge earthquake on groundwater. • However, so far, almost no such studies have been carried out mainly because no densely distributed groundwater level observations were available at a short time interval when a large earthquake occurred.
The Great East Japan Earthquake The most powerful earthquake ever recorded in Japan with a magnitude of 9.0 (Mw) (4th strongest in the world), occurred at 14:46 JST on March 11, 2011 More than 18,000 people were sacrificed or missing mostly by Tsunami In Tokyo, 5 upper intensity was observed, where more than 400km away from the epicenter
Groundwater Monitoring Network in Tokyo The hourly groundwater levels have been observed since 1952 □ observation sites ・・・ 42sites ● Confined wells ・・・ 89 wells ● Unconfined wells ・・・ 13 wells
Telemeter Inside a Groundwater Observation House Water Level Gage Observation wells Subsidence Measuring Apparatus • 42 observation sites in Tokyo. • Most observation sites have several different depth observation wells.
Objective • Taking full advantage of the unique rare case data from the dense groundwater monitoring network in Tokyo, • We identify the fluctuation patterns of groundwater levels caused by the Great East Japan Earthquake usingSOM, • Which has never been investigated in Tokyo area.
One-month hourly time series data of 98 wells (85 confined and 13 unconfined wells) in March, 2011, excluding missing data wells. The fluctuation patterns of the time series were analyzed and identified by SOM. Data Used for the Objective
Groundwater level changes by the Earthquake Confined Wells The effects of rain → None mm/h T.P ( m) 14:46 32-1:C-DR 16-1:C-DC T.P ( m) 14:46 26-1:C-N Scheduled blackouts Peculiar case 20-1:C-DI 6-1:C-IC
Groundwater level changes by the Earthquake Unconfined Wells mm/h 14:46 14-4:U-I Scheduled blackouts 5-1:U-I
SOM Method • SOM was developed by Kohonen, which is one of unsupervised training Neural Networks • SOM projects high-dimensional, complex data onto two-dimensional regularly-arranged nodes • SOM obtains useful and informative reference vectors of all nodes • In this study, SOM is used to clusterfluctuation of groundwater level changes
Input data for SOM • 16:00, 11 March – 14:00 of the same day • (b) 14:00, 12 March-16:00, 11 March • (c) the mean value of 14 March -14:00, 12March • (d) the mean value of 31 March – that of 14 March • (e) The altitude value of the depth of the screen. (T.P. : standard mean sea level of Tokyo Bay) Considering the crustal deformation in Tokyo after the Earthquake was4 cm at the most, ± less than 5 cm fluctuation water level in (a) to (d) is shown as 0, and ±5 cm or any value greater is shown as +1 or -1
Input data for SOM 0 0 -1 +1
SOM Implementation Map size M = 5√n M:Number of total node, n:Number of Input data M n = 98 → M =50 node DBIValue Ward’s method
Identified Values for 5 Variables by SOM ―Legend― (d) End of month (c) three days later (b) Next day (a) Just afterthe quake Small Large Large Difference in water level Small Large Small ―Legend― (e) Strainer depth (a)~(d): Difference in underground water level(standardized) (d):Depth of screen (standard mean sea level of Tokyo Bay ) Depth (T.P.) Deep Number of Wells belong to each node Shallow
SOM Clustering Result Group 1 Group 2 Group 3 The fluctuation patterns of groundwater level could be classified into eight clusters, which are summed up to three groups.
Rader Charts of Main Clusters Cluster 3 Cluster 5 Cluster 6 Cluster 3: Sharp drawdown just after the earthquake, and rised higher than the original level. Cluster 5: Sharp drawdown just after the earthquake, and recovered to the original level. Cluster 6: Abrupt rise just after the earthquake, and decreased. Shallow wells.
Cause of Sharp Drawdowns expansion Tokyo compression Crustal Deformation for East Japan Area Ground Movements in Tokyo • Pressure release by crustal expansion
Cause of Abrupt Rises • Phenomenon of soil liquefaction
Cause of Rising Tendency after Drawdown Tama's Drinking water source level in March 2011 Monthly Amount of Groundwater Pumping Rate for 3 years from 2009 to 2011 • Decrease of Groundwater Pumping Rate
The Great East Japan Earthquake triggered the fluctuations of groundwater level in Tokyo. By applying SOM, The fluctuation patterns of groundwater level were classified into eight clusters and three groups. Sharp drawdown just after the Earthquake was the typical phenomenon for confined wells, which is caused by the pressure release derived from crustal expansion. Abrupt rise just after the Earthquake, esp. for shallow wells will be caused by the soil liquefaction The most common fluctuation pattern is the drawdown followed by the rising tendency, which is mainly caused by decreased groundwater pumping rate. Conclusions
Distribution of Change Patterns Just after the Earthquake 89 Confined Wells Confined groundwater 89 wells • Justafter the earthquake (14:00~16:00) ▲ :Water level Rising over 5cm ▼:Water level Drawdown over 5cm ―: Water level NO change ▲:3wells(Lowland)▼:79wells(All zone) ー : 7wells(Terrace)
Distribution of Change Patterns Just after the Earthquake 13 Unconfined Wells Unconfined groundwater 13 wells • Justafter the earthquake (14:00~16:00) ▲ :Water level Rising over 5cm ▼:Water level Drawdown over 5cm ―: Water level No Change ▲:2wells(Lowland)▼:1wells(All zone) ー : 10wells(Terrace)
Categorization of the Fluctuation Patterns 89 Confined Wells 89% 3% 8%
Grouping of Fluctuation Patterns Unconfined Wells 8% 15% 77%
Consideration of Confined wells Factor of no significant changes • Diminutionof pressure was little because of not minute geological formations.
Types of Observation Wells 8wells 96wells Φ20cm Φ20~5cm 74wells 30wells
Groundwater level changes by the Earthquake Confined Wells mm/h 14:46 T.P ( m) 8-1:C-I D 13-3:C-DC 5-2:C-DR 4-1:C-I I
3-3 クラスター別の水位変動パターン特性3-3 クラスター別の水位変動パターン特性 Cluster- 1 Cluster- 2 Cluster- 3 Cluster- 4 Cluster- 5 Cluster- 6 Cluster- 7 Cluster- 8 (a) 地震直後 (b) 翌 日 (c) 3日後 (d) 月 末 (e) 深 度 - 凡 例 - ―― : 第1四分位 ―― : 中 央 値 - ― -: 第3四分位
3-3 Group-1の分布特性 ストレーナ深度 ・Cluster- 1, Cluster- 3, Cluster- 8 ・Group-1: 地震直後に大きく水位低下,翌日までに回復 14日までに上昇・ 31日まで継続,深度は中間的 14日 31日 11日 12日
3-3 Group-2の分布特性 ストレーナ深度 ・Cluster- 2, Cluster- 5, Cluster- 7 ・Group-2: 直後に比較的大きな水位低下・翌日まで継続, 14日までに戻り傾向・ 31日まで継続,深度は深め 14日 31日 11日 12日
3-3 Group-3の分布特性 ストレーナ深度 ・Cluster- 4, Cluster- 6 14日 14日 31日 31日 11日 11日 12日 12日 ・Group-3:直後に若干の水位上昇,または大きな変動なし その後も大きな変動なし,深度はかなり浅い