Cost Estimation
Cost Estimation. Chapter 11. Cost Estimation. Estimating the relationships between costs and the related cost drivers Cost estimation allows for Better cost management Better decision making Better planning Better standard setting. Statistical Cost Estimation. Simple regression analysis

Cost Estimation
E N D
Presentation Transcript
Cost Estimation Chapter 11
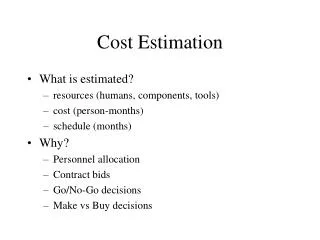
Cost Estimation • Estimating the relationships between costs and the related cost drivers • Cost estimation allows for • Better cost management • Better decision making • Better planning • Better standard setting
Statistical Cost Estimation • Simple regression analysis • Cost estimation based on one driver • TC = F + VX • Where: TC = total cost (dependent variable) F = fixed cost V = variable cost per unit of driver X = quantity of the cost driver (independent variable)
Statistical Cost Estimation • Step 1: Identify the most likely cost driver • Step 2: Gather data on the cost and cost driver • Accuracy increases with the number of data points • Step 3: Draw scattergraph to visually inspect the data • Investigate outliers and remove if necessary
Statistical Cost Estimation • Step 4: Perform regression analysis • Excel formulas for intercept, slope and RSQ • Excel data analysis package for regression • Step 5: Interpret the results • Coefficients • Intercept = fixed cost • X variable = variable cost per unit of driver • R square = measure of how well the model fits the data (1.0 is perfect fit, 0.0 is perfectly random)
Statistical Cost Estimation • Multiple regression analysis • Similar to simple regression, but incorporates multiple cost drivers (independent variables) • TC = F + V(1)X(1) + V(2)X(2) + V(3)X(3) + … • Where: TC = total cost (dependent variable) F = fixed cost V(j) = variable cost per unit of driver j X(j) = quantity of the cost driver j (independent variables)
Statistical Cost Estimation • Multiple regression follows the same steps as simple regression • Exceptions • Adjusted R square is used instead of R square • More independent variables may not make the model better or more accurate • Watch for negative coefficients (cost decreases for each unit of the driver activity)
Account Analysis Method • Attempts to identify costs with various activity pools and derive an average cost per unit of the related cost driver • Example • How much total cost was incurred to attract new customer? • How many new customers were attracted? • Divide to get the cost per new customer • Costly and not as reliable as regression
Engineering Method • Relies on expected future activity and costs • Forward-looking activity-based costing • Expected activities are analyzed to determine the resources they will consume • The cost of the resources are estimated • Dividing gives the average cost per unit of activity • Can be costly and time consuming
Which Method is Best? • It depends • Cost/benefit tradeoffs • Accuracy desired • Relevance • Models based on past data or expected future data • Complexity does not guarantee superior results • Comparison of several models may be best
Complicating Factors • Estimation outside the relevant range • Estimated activity is above or below the amounts used to develop the model • Non-linear costs • Step costs • Mixed costs • Curvilinear costs • Variable cost per unit is not constant across the relevant range
Complicating Factors • Regression analysis and account analysis are based on prior data • Models lose accuracy if costs or quantities of resources change in the future