Download
1 / 21
210 likes | 223 Views
Detailed configuration and simulation conditions for a detector with tungsten powder and polystyrene fibers. Explore energy deposition, position resolution, and photon reconstruction techniques.

E N D
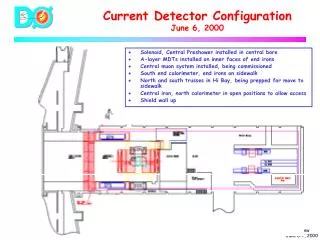
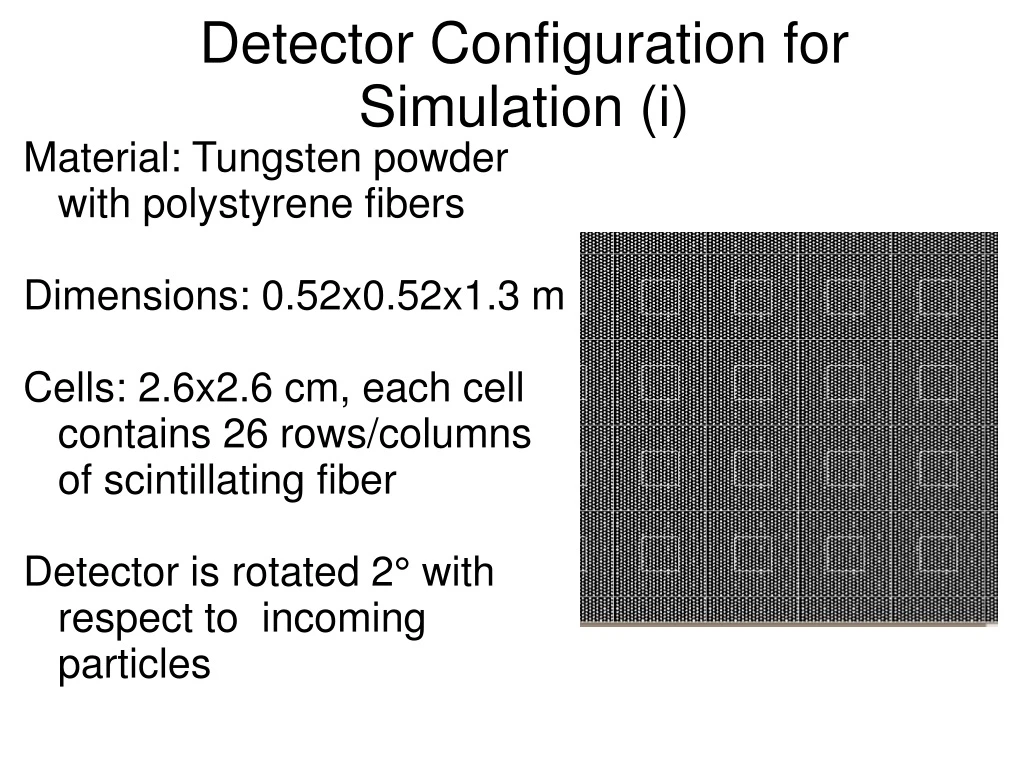
Detector Configuration for Simulation (i) Material: Tungsten powder with polystyrene fibers Dimensions: 0.52x0.52x1.3 m Cells: 2.6x2.6 cm, each cell contains 26 rows/columns of scintillating fiber Detector is rotated 2° with respect to incoming particles
Scintillating fibers are 1mm in diameter and run the length of the detector The radiation length of the mixture of tungsten and polystyrene is 8.7mm and the nuclear interaction length is 21.2 cm. The length of the detector was chosen to be about 6 nucl. int. lengths. The geometry specified for this simulation is about ¼ what is necessary to fill open FMS configuration Detector Configuration for Simulation (ii)
Simulation Conditions Cutoffs are left at their default values (1 mm) Light attenuation in the scintillating fiber is not included Particles are fired from a distance of 7.5 meters Information is stored in a ROOT tree file which tracks the energy deposition in the fibers in each cell Energy, momentum and impact point from GEANT4 are saved for comparison 3 3
Example Events i ii Energy deposition (GeV) in fibers for a 20 GeV photon (i) and π0 (ii) Horizontal axes label the cell number 4
Molière Radius cm Radial distribution of shower energy in uniform mixture of tungsten and polystyrene. Molière radius at 90% was determined to be 2.5 cm. This result was also confirmed later for the actual fiber/block geometry. 5
Position and Energy Resolution (i) GeV Energy deposition in the entire volume of fibers for single 10 GeV photons. Shows resolution of ~4% and sampling fraction of 2.4% 6
Position and Energy Resolution (ii) cm cm Position as determined by center of gravity method for 1k 10 GeV photons 7
Identifying 2 Photon Events We aim to distinguish single photons from 2 photons by computing a weighted moment of the energy in the shower: Where w is a constant. The best value for w was determined to be .8, which gives 98% rejection of π0 at 80 GeV 9
Rudimentary Attempt to Reconstruct π0 • Require two highest cells to be separated, i.e. two highest cells must have a lower cell between them or be diagonal to each other • Use template shower from single photon event scaled to appropriate energy • Divide energy from shared cells based on template shower • Calculate center of gravity for each shower • Apply correction function to center of gravity (see next slide)
Invariant Mass Reconstruction (i) π0 energy clockwise from top left: 20 GeV, 40 GeV, 50 GeV
Invariant Mass Reconstruction (ii) 60 GeV 80 GeV
π0 Reconstruction: Efficiency The pion reconstruction efficiency as a function of energy. There is a distinct dip in efficiency in the 40-50 GeV range the reason for this is unclear.
π0 Reconstruction: Summary This method provides reasonable results for lower energy π0s. Noticeably worse in the 40-50 GeV region. This may be due to the typical photon separation being around 1.5 cell sizes. CM calculations may then produce large errors in opening angle. Beyond 80 GeV the photon separation is rarely large enough to have the two high cells be nonadjacent This method is inherently biased towards highly asymmetric decays 17
Fitting the Shower Shape The previous method used a reference shower from only one impact parameter This can make it weak at reconstructing showers where the impact point differs significantly from that of the reference We would prefer to reconstruct the showers by fitting them to a general shower shape function and extracting the relevant parameters from there 18 18
Determining the Shower Shape To determine a shower shape function photons at 50 GeV were fired uniformly over one cell face. The energy in all cells was recorded as a function of the radial distance from the impact point of the function This distribution was then normalized to create a single shower energy distribution Radial shower energy distribution x-axis in cm 19 19
Fitting the Shower Shape Attempted to fit the energy distribution projected onto a single axis (shown at right) Fitting function uses 4th order exponential to fit the sharp falloff and two Gaussians to fit the broad base Still have difficulty recreating the shape of the peak at the center Photon shower shape with fitting function of the form:
We have outlined the basic performance characteristics for a tungsten/fiber calorimeter We have also shown some basic ability to distinguish single and two photon events, and to reconstruct π0s Still must determine the best method for fitting showers. Appropriate fitting function? How much better is pion reconstruction at higher energies? Will a better procedure fix some of the problems with the current method? Begin looking at electron/hadron separation Conclusions and future work