Download
1 / 29
300 likes | 480 Views
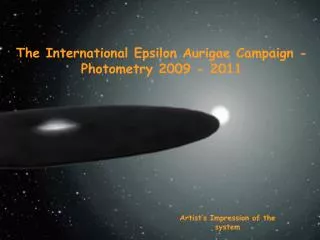
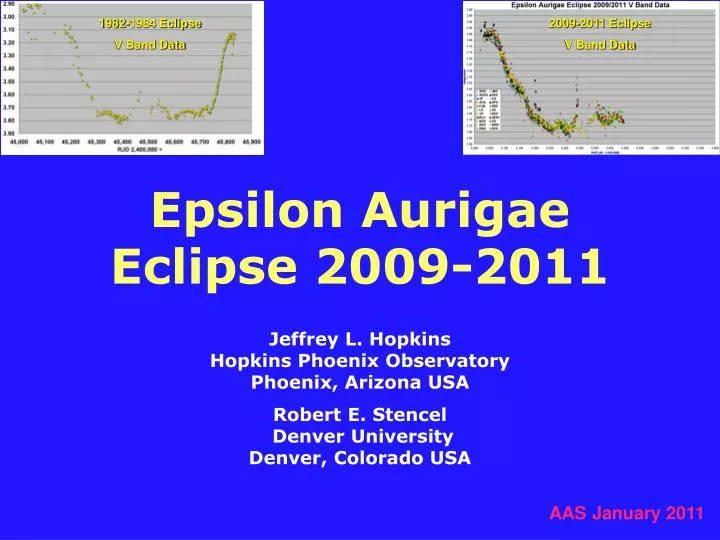
1982-1984 Eclipse V Band Data. 2009-2011 Eclipse V Band Data. Epsilon Aurigae Eclipse 2009-2011. Jeffrey L. Hopkins Hopkins Phoenix Observatory Phoenix, Arizona USA Robert E. Stencel Denver University Denver, Colorado USA. AAS January 2011. Introduction.

E N D
1982-1984 Eclipse V Band Data 2009-2011 Eclipse V Band Data Epsilon Aurigae Eclipse 2009-2011 Jeffrey L. HopkinsHopkins Phoenix ObservatoryPhoenix, Arizona USA Robert E. Stencel Denver University Denver, Colorado USA AAS January 2011
Introduction During the 1982-1984 eclipse of epsilon Aurigae an Eclipse Campaign was formed and we published 13 hard copy periodic Newsletters that were sent around the world. This was before the Internet, no web sites, no e-mail. While the current eclipse started in August of 2009, to get a head start a new Campaign was started in May of 2006. A web site was created. This site now has a vast amount of data as well as 20 published pdf Newsletters available free. In November of 2009 we started a Yahoo list to act as a forum for near instant communication to all interested in the Campaign. We have 57 official Campaign members from 17 countries with 24 members from 10 different countries submitting high quality photometric and spectroscopic data. Nearly 2,600 UBVRI photometric observations have been submitted.
Surprise The 1982-1984 Eclipse Campaign saw a large amount of high quality photometric data by advanced amateurs and small observatories. Spectroscopy data were scarce and limited to large observatories. The current Eclipse Campaign has seen a big change. In addition to the high quality photometric data, excellent spectroscopic coverage of several spectral regions of epsilon Aurigae has been provided by similar advanced amateurs and small observatories. No longer are high quality spectra reserved for only the large observatories.
Photometric Contact PointsThird Contact is due mid-March 2011Fourth contact is due mid-May 2011
Photometry Equipment Single Channel PMT Based UBV Photon Counting (High Precision) PIN Diode Optec SSP-3 BVRI PIN Diode Optec SSP-4 JH CCD CCD BVRI Digital Single Lens Reflex Camera (DSLR - V) No telescope or tracking Note: CCD Bright Star Photometry requires Special Techniques.
HPO UBV Photon Counting HPO C-8 Telescope and High Precision UBV PMT Based Photon Counting Photometer Inside Compact Photometer Head Photometer Head
SSP-3/SSP-4 Photometers Optec SSP-3 BVRI Photometer Optec SSP-4 JH Photometer PIN Diode Solid State Single Channel Photometers
CCD Photometry DSI Pro CCD Camera, BVRI filters, Adapter and 50 mm Camera Lens
Special CCD Techniques For CCD photometry some special techniques are required. Linearity - The point where linearity breaks must be determined and exposure times set for maximum pixel ADU counts to stay below that value. Undersampling - Because of the brightness of epsilon Aurigae, a telescope is not needed and usually just a camera lens used. This makes a very fast setup and very small star images which presents a problem with undersampling. This is solved by defocusing and/or just not tracking the star during the exposure. 3. A pleasant surprise from this is the ability to use a DSLR camera on a tripod to do excellent V band photometry.
DSLR Photometry Des Loughney, Edinburgh, Scotland UK (Over 150 high-Quality V Band Data Points) No Telescope Needed
HPO V Plot 2009-2011 RJD = JD - 2,450,000
HPO U&B Plot 2009-2011 B U RJD = JD - 2,450,000
Campaign Spectroscopy The European’s Lead the World in Small Observatory Spectroscopy
Robin Leadbeater & Olivier Thizy EnglandThree Hills Observatory France Shelyak,Inc
Spectroscopic Equipment Low Resolution Star Analyser 100 lines/mm grating(~$200) High Resolution Lhires III Spectrograph 2,400 lines/mm Grating(~$3,000) Free Software eShel Spectrograph Covers Whole Visible Spectrum at One Time At High Resolution(~$17,000) IRIS VSpec SpcAudace
Campaign High Resolution Spectra Sodium D Lines to Potassium I 7699 Å Lines
Sodium D line Spectra Taken with 12” GPS200 Telescope and Lhires III w/2400 l/mm Grating
Blue Hills Observatory Out-Of-Eclipse Ha Spectra 30 July 2008 Taken with a 16” Meade GPS200 and Lhires III w/ 2400 l/mm Grating Note Large Blue Emission Horn
Strange Ha Spectrum In addition to the main hydrogen alpha absorption line there are sometimes large Doppler shifted emission lines bracketing it. These emission lines are known as the hydrogen alpha blue and red wings or horns. These appear out-of-eclipse and do a wild and random dance. In addition during most of the eclipse totality the red and blue horns disappeared completely, but a strange emission spike appeared in the main absorption line and migrated from the blue side to the red side as the eclipse progressed.
Ha Emission HornsOut-of-Eclipse Blue Emission Horn Red Emission Horn Red Emission Horn No Red Emission Horn No Blue Emission Horn Blue Emission Horn 6563 Å 6563 Å 6563 Å Main Absorption Line Main Absorption Line Main Absorption Line 07 September 2009 14 September 2009 25 September 2009 Variation of Ha Blue and Red Horns By Thierry Garrel Observatoire de Foncaude Juvignac, France, using a Lhires III Spectrograph
Mid-Eclipse Ha Absorption Spectra Jose RibeiroPortugal 24 July 2010 01 October 2010 Note lack of Emission Horns and large Emission Spike in Absorption Line migrating toward the red
K I Spectra Evolution Three Hills Observatory using Modified Lhires III
Conclusion Technology has made great strides since the 1982-1984 eclipse. This has provided us with relatively inexpensive photometers and spectrographs allowing even more people to do valuable scientific observing.
Acknowledgements We would like to thank the people of Shelyak, Inc. (notably Olivier Thizy) for designing and making available reasonably priced high quality spectroscopic equipment and to the several software developers who have provided excellent free spectroscopic software. And a special thanks to all the worldwide observers who have been and are continuing to contribute high quality photometric and spectroscopic data to this Eclipse Campaign.