CGI
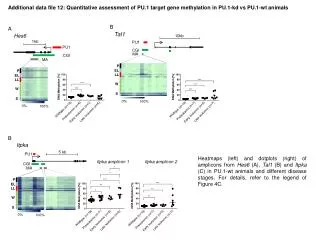
Additional data file 12: Quantitative assessment of PU.1 target gene methylation in PU.1-kd vs PU.1-wt animals. B. A. Tal1. Hes6. 10kb. 1kb. PU1. PU1. ***. CGI. MA. CGI. MA. ***. ***. Wildtype (n=19). Wildtype (n=19). Wildtype (n=19). Wildtype (n=19). P.

CGI
E N D
Presentation Transcript
Additional datafile 12: Quantitative assessmentofPU.1 targetgenemethylation in PU.1-kd vs PU.1-wt animals B A Tal1 Hes6 10kb 1kb PU1 PU1 *** CGI MA CGI MA *** *** Wildtype (n=19) Wildtype (n=19) Wildtype (n=19) Wildtype (n=19) P Preleukemic (n=7) Preleukemic (n=6) Preleukemic (n=7) Preleukemic (n=7) Lateleukemic(n=6) Lateleukemic(n=7) Lateleukemic(n=6) Lateleukemic(n=7) Early leukemic(n=5) Early leukemic(n=5) Early leukemic(n=5) Early leukemic(n=5) EL P LL EL LL *** W *** W 0% 0% 0% 100% 100% 100% S S B Itpka 5 kb PU1 Heatmaps(left) and dotplots (right) of amplicons from Hes6 (A), Tal1 (B) and Itpka (C) in PU.1-wt animals and different disease stages. For details, refer to the legend of Figure 4C. Itpkaamplicon 2 Itpkaamplicon 1 CGI MA * * P *** *** EL ** LL ** * ** W S