Download
1 / 49
490 likes | 516 Views
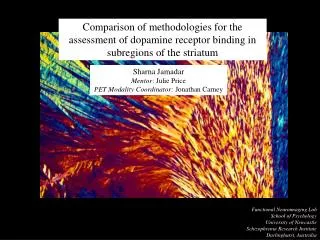
Explore the potential of bio-nanocatalysts in the production of bioenergy and their application in bio-remediation processes. This study focuses on the use of bacteria such as Escherichia coli, Rhodobacter sphaeroides, and Desulfovibrio desulfuricans to convert organic waste into valuable energy sources. Additionally, the study investigates the use of bioinorganic catalysts, specifically nanoparticles, for various catalytic reactions. The combination of biological and nanotechnological approaches offers a sustainable and efficient solution for energy production and waste management.

E N D
Unit of Functional Bionanomaterials School of Biosciences Mark D. Redwood, Kevin Deplanche, Angela Murray, Iryna P. Mikheenko, Ping Yong, Neil J. Creamer, Rafael Orozco, Oluwakemi Lowal, Lynne E Macaskie. 19th May 2010
Prof Lynne E Macaskie Applied Microbiology Bio- nanocatalyst Bio- energy Bio-remediation
Making bioenergy Escherichia coli Rhodobacter sphaeroides ; capsulatus Making bionano catalyst Desulfovibrio desulfuricans ; fructosovorans Escherichia coli Ralstonia, Rhodobacter spp, Micrococcus spp., Shewanella, Geobacter, Arthrobacter (Making ion exchangers)
H2 Dark Fermentation Photo- Fermentation Sugary wastes Organic acids
UK [food industry + domestic] = 24 M tpa • Potential to produce 280 M kg of bio-H2 • Energy value: 5.6 TWh (terawatthour) and heat • 13% of 2020 target • 15% renewable sources. • Total waste is ~110 M tpa inc. agricultural and sewage
Unique combination of advantages: • Renewable/sustainable energy sources • Organic matter and sunlight • Inherently free of fuel cell poisons • CO, H2S • Waste disposal • Food waste • Agricultural residues • Simple/cheap process • Ambient temperature & pressure
Ideally: 1 Glucose 2 H2 + 1 acetate + 1 ethanol + 2 CO2 • We select E. coli because • Fast aerobic growth • Tolerance to O2 during anaerobic fermentation • Best tolerance to H2 partial pressure • No sporulation • Best-characterised genetic background for GM • E.g. removal of uptake hydrogenases • ‘electrotolerance’
Anion Cation Anion-selective membrane +/- Fermentation Concentrated organic acids - + • Electrodialysis uses an anion selective membrane and direct current • Organic acids cross the membrane due to negative charge
Solid residues Juice Infusion Hydrolysate Fermentation Waste Fruit Stones Insolubles and by-products Manual chopping Water Water 1st Press Pressings Wash Hot Compressed Water (HCW) 2nd press Washed Pressings Detoxification
Organic acids H2 + CO2 • Anoxygenic photosynthesis • Purple non-sulphur bacteria • Rhodobacter spp. • High yield, broad substrate range • e.g. Lactate 6 H2 • H2 produced by Nitrogenase enzyme • Very sensitive to NH4+ • Select wastes with high C/N • Light conversion efficiency • Up to ~5%
Logging equipment for light intensity and temperature. March, June and October 250 ml reactors + water-jacket Water heater pumps 30 °C water to the jackets
Tubular array • Simulates 0.5 m2 of sunlit area • Volume : up to 50 L • Lamps deliver programmed light patterns • Simulates any location or season
Results from solar simulation PBR Equatorial UK
Results from solar simulation PBR Equatorial UK
* Including parasitic energy and total site area. Published values use the raw energy generated and only the space occupied by the digester.
Bioinorganic Catalysts • When Biology meets Nanotechnology • Reduction of metal precursors using bacterial enzymes yields highly active nanoparticles (NPs) at the cell surface
Hydrogenase enzymes 2H+ + Pd0(s) Bacterial cell Bacteria concentrate precious metals
Palladised cells of D. desulfuricans Stabilised nano-Pd(0) crystals bound tocells. Similar results with Pt(0) Nanoparticles grow and erupt from the cells Atom-scale resolution shows crystal structure; faces are clearly visible (5 nm Pd-nanoparticle)
Bioinorganic Catalysts • Biocatalyst manufacture process optimised for PGMs • Pd, Pt, Au • Monometallic and bimetallic • Manufacture can be coupled to biorecovery of metals from wastes • ‘Green chemistry’ • Lower the threshold of economic recovery of PGMs
Advantages over conventional chemical catalysts • Cheap(er), “green” manufacturing process • Easy to scale up • Excellent monodispersity of NPs • Bacterial support doesn’t leach metals • Can be recycled • Exhibit different properties from chemical catalysts • Active in a broad range of reactions
Manufacture of platform chemicals • Selective hydrogenations (Pd, Pt) • E.g. Heck coupling (pharma) • Selective oxidations (Au, Au/Pd) • Perfume industry, food additives… • Remediation of recalcitrant compounds (TCE) • Green energy • Conversion of biodiesel wastes (glycerol-Au) • Automotive catalysts • Reduction of pollutant emissions (CO, NOx) • Improvement of performances • Fuel cells electrocatalysts (PEMFC)
Tested catalyst by recycling in a series of reactions • Compared selectivity and conversion
With Pd/C, rate drops substantially with each run • Key feature of BioPd: increased recyclability – shelf life
Why is there a difference in activity between bio-Pd and Pd/C? • Smaller particles; greater proportion of corner atoms and adatoms • more active in Heck coupling (Augustine et al., J. Mol. Cat. A., 1995, 95, 277-285) • CO chemisorption experiments shows bio-Pd contains much smaller Pd particles than Pd/C adatom corner atom
Heck Reaction Mechanism • Soluble Pd(II) complexes are the catalytic species • Solid Pd(0) Soluble Pd(II) complexes • catalyses Heck coupling • Pd(II)Pd(0) at the end of the cycle Pd(II) Pd(0) bacterial cell bacterial cell Pd(II) Pd(0) Carbon Carbon
Heck Reaction Mechanism • The Pd particles may redeposit • on the support’s surface directly • on top of other Pd particles already on the support • Pd particles reform on other Pd particles, thus the particle size grows • Zhao et al., J. Mol. Cat. A., 2002, 180, 211-219 • BioPd maintains small particle size through 6 runs • Initially smaller particles • Redeposition onto biomass Pd(II) Pd(0) Carbon Carbon
500 nm Oxidations – BioPd/Au HAADF analysis • Bimetallic catalyst with high numbers of Au core/Pd shell NPs TEM analysis
Oxidations – BioPd/Au • Selective oxidation of benzyl alcohol to benzaldehyde Benzene Benzoic acid Benzyl aldehyde Benzyl alcohol 5% Pd/C Toluene Benzyl benzoate • High constant selectivity towards benzylaldehyde • Work in progress on a range of alcohols
Area of Research Recovery of Platinum Group Metals from Secondary Sources Incinerator Ash Road Dust Industrial Slag Materials Electronics scrap Physical Processing to Upgrade Metals Chemical Leaching to Solubilise Metals Recovery of Metals using Bacteria Added Value End Product
Feed Hopper Ionising electrode Vibratory feeder Static electrode Earthed titanium roll Brush Insulators Middling Conductors Electrostatic Separation Electrostatic separations separate one material from another by exploiting the difference in electrical conductivity. High Tension roll separator was tested using a titanium roll set at 53rpm
Road Dust in UK • In the UK Local Authorities collect road dust • They store it at regional depots • It is then sent for expensive landfill • Valueless Material • Disposal costs associated with it • Research has shown PGM levels in road dust of 1.8 parts per million (ppm) • Primary PGMs mined in South Africa at 4-10 ppm from deep underground • PGMs also mined in Canada at less than 1ppm • Therefore Road Dust levels comparable to primary low grade ores
2 spin out companies • Biowaste2energy Ltd • Bioenergy from organic wastes • Roads2Riches Ltd • Precious metal recovery from wastes www.bw2e.com
Electrical Load H2 Anode 2 H2 → 4 H+ + 4 e- Pt catalyst H+ Proton exchange membrane Pt catalyst Cathode O2 + 4 e- + 4 H+ → 2 H2O e- flow O2 2 Requirements: PGM nano-catalyst and clean hydrogen Aim: Bio-based fuel cell using biohydrogen and bio-recovered Pt
Fuel cell catalyst Power output (Pmax, mW) Power outputs (Pmax, mW) Bio-Pd(0) ~5% metal/cells ~25% metal/cells Commercial Pt(0) (FC catalyst) 170 NT D. desulfuricans Bio-Pt 170 NT Commercial Pd(0) 100 NT D. desulfuricans Bio-Pd108 140 E. coli MC4100 Bio-Pd 18 29 E. coli mutant Bio-Pd 56 114 E. coli mutant (waste PM) NT 66
Organic waste Pre- treatment Bioenergy reactors H2 PEM-FC Clean Energy Bacteria Metal waste Sorption & reduction Catalyst Metallised cells Chemical industry
HUO2PO4.nH2O (HUP) • Grow Serratia biofilm (3L bubble column reactor) • Supply biofilm with G2P and Uranium • Phosphatase forms Hydrogen Uranyl Phosphate (HUP) • (Alternatively Zirconium phosphate) • Result: “Primed” biofilm, ready to adsorb radioactive metals – e.g. Strontium, Cobalt, Caesium Phosphatase within extracellular polymeric substance Periplasmic phosphatase Bacterial cell Sodium glycerol 2-phosphate (G2P) HPO42- UO22+
2 cm Cleaned outflow solution Polyurethane foam coated with primed biofilm 5 cm Contaminated inflow solution Reactor volume: ~8 mL Ion exchange 15ml column volume Examples of inflow radioactive metals: 60Co, 85Sr and 137Cs
Ion exchange Tests performed at the Korea Atomic Energy Research Institute (KAERI). Removal of 60Co, 85Sr and 137Cs from simulated radioactive waste solution by ion exchange using reactors containing HUP supported on biofilm Simulated radioactive waste:137Cs, 85Sr and 60Co (0.333 mM), pH 5.44, flow rate 10 mL/h Breakthrough capacity:137Cs = 0.11 mmol, 85Sr = 0.055 mmol, 60Co = 0.055 mmol Efficiency: 97%
3 integrated processes 3 inter-related themes Organic waste Pre- treatment Bio-process Sugar feed Bacterial cells H2 Metal waste Sorption & reduction Catalyst Pd/Pt coated cells PEM-FC Energy Uranyl nitrate Sorption & reduction Ion exchanger HUP-coated cells Decontamination of nuclear waste
2 1.5 Mol of H2 equivalent 1 0.5