CWA
CWA. Today 10-11:20 Peak Oil/ Macky 11:30-12:50 Future of Food/ Macky 1-2:20 Science for Sale/ West Ballroom *** 3-4:20 Challenge of Renewable Energy/G1B30. CWA-Thursday & Friday. 3:30-4:50 Science and Politics of Climate Change/UMC 235

CWA
E N D
Presentation Transcript
CWA Today 10-11:20 Peak Oil/ Macky 11:30-12:50 Future of Food/Macky 1-2:20 Science for Sale/ West Ballroom *** 3-4:20 Challenge of Renewable Energy/G1B30
CWA-Thursday & Friday • 3:30-4:50 Science and Politics of Climate Change/UMC 235 • Friday-Climate Change: Cost and Opportunity for Poor Nations/UMC West Ballroom
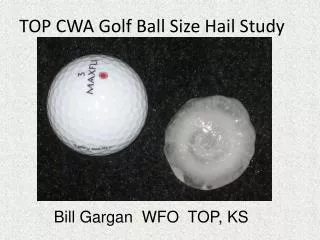
Near term trends How much CO2 are we adding each year? How long does it stay in the air? Where does it go?
So what? The average from 1980 to 2010 is 100 Quad Btu. How much CO2 did that make? 100 Q=100x1015 Btu/yr x 30 years / 2.66x10⁷ Btu/ton=113 billion tons of coal were burned. Making 113 billion x ½ (Carbon in coal) x 44/12 (CO2/C)=207 billion tons of CO2. The mass of the atmosphere is 5.7 x10¹⁵ tons (page 288), so coal added 207x109/5.7x1015=36x10-6=36 ppmM to the air, from coal Fig. 10.3, in those years CO2 rose from 335 to 385 = 50 ppmV=76 ppmM
Conclusion-- • At least much of the recent increase in atmospheric CO2 arises from burning fossil fuels. Anthropogenic.
Then what? • CO2 can be absorbed into the oceans. • CO2 can be taken up by plants. • CO2 can be taken up by soils, bacteria. • What is left stays in the atmosphere. • Average ‘residence time’ = 50-100 years
Thus Given the laws of radiative transport and the observed facts of molecular absorption, this added CO2 must increase the greenhouse effect and warm the planet. A ‘causality’. Accounting for the observed temperature increase. An ‘inference’
And/Or…. Is it the sun, changing its output? Is it cosmic rays, perhaps modulated by changes in the sun? Is it ‘just a natural cycle’? Is the fuss created by those with something to gain? Is it a game to increase science funding?
The sun is dynamic • Stars evolve, 4.5 billion years ago insolation only 75% of present • Stars vary, on many time scales • Our star has an 11 year sunspot cycle.
Milankovich cycles The earth’s orbit is an ellipse--23,000 yr. The earth’s axis is titled, and changes--41.000 yr. The earth’s rotation axis precesses--26,000 yr. About every 100,000 years, these line up.
Cosmic rays High energy protons, from galactic sources and the sun. Make the 14C we use to date things. Influenced by earth’s magnetic field, which is in turn altered by solar activity. Would ionize air, nucleation of cloud droplets.
Conclusion-- Seek correlations between observations and climate changes. On the scale of decades, solar irradiance, earth orbit/rotation, cosmic rays are NOT a major source of global warming.
Rate of change Global coal increased from 70 to 130 (average 100) Q per year, from 1980-2006. The increase was (130-70)/100 = 60%. The average annual rate of increase was 60%/26 years=2.3% per year. The extrapolation.
Exponential growth • If the global economy grows by x%/year, we also need to increase coal usage by x% per year, compounded. See Appendix 1. • The rate of growth itself also must increase! • Amount = initial amount x 1.026 x 1.026 x1.026… = initial amount x (1.026) time in years , not x years x 1.026, linear. • A steeper curve each year!
More recently (bp yearbook) Coal usage is increasing at 6% per year, and its CO2 also at 6% per year. How much coal CO2 in 2030? calculator’ y x ‘, with y= 1 + rate of increase, x= years
2. (6) If the world burns 8 billion tons of coal this year, and • coal is half carbon, how many tons of CO2 do we dump • into the atmosphere this year? The atmosphere has a • mass of 5.7x10¹⁵ English tons (page 288)=5.2x10¹⁵ metric • tonnes. How many parts per million by mass will our 2010 • emissions change the CO2 content of the atmosphere? • 3.(4) If coal burning continues to increase at 6% per year, • how many tons of CO2 will be dumped into the air in the • year 2030? This is a ‘compound interest’ problem, as • discussed in class. • 4.(4) CO2 molecules are heavier than air molecules by a • factor of 1.52. By how many parts per million by volume • will your answer to Problem 2 change the CO2 content • of our atmosphere in one year? Look at Fig. 10.3 and comment.
Revised HW for April 12 1. (6) Go to www.windows.ucar.edu/tour/link=/earth/climate/sun_ radiation_at_earth.html. After reading the ‘intermediate’ text, use the calculator provided to give the temperature of the earth at its current albedo of 0.31, and then recompute the temperature at an albedo of 0.35 (shinier) and 0.25 (darker).