Download
1 / 114
1.14k likes | 1.21k Views
Understand measurement concepts, reduce variation, and ensure high data quality. Learn about gauge studies, analysis methods, and error terminology. Improve product quality through measurement system optimization.

E N D
Definition Measurement The assignment of numbers to material things to represent the relationships among them with respect to particular properties. C. Eisenhart (1963)
Measurement Systems Analysis Basic Concepts of Measurement Systems A Process Statistics and the Analysis of Measurement Systems Conducting a Measurement Systems Analysis ISO - TC 69 is the Statistics Group Ensures high ‘Data Quality’ (Think of Bias)
Course Focus & Flow Measurement as a Process • Mechanical Aspects (vs Destructive) Piece part Continuous (fabric) • Features of a Measurement System • Methods of Analysis • Gauge R&R Studies • Special Gauging Situations Go/No-Go Destructive Tests
The Target & Goal Continuous Improvement Production Pre-Launch Prototype USL LSL
Key Words • Discrimination Ability to tell things apart • Bias [per AIAG] (Accuracy) • Repeatability [per AIAG](Precision) • Reproducibility • Linearity • Stability
Terminology • Error ≠ Mistake • Error ≠ Uncertainty • Percentage Error ≠ Percentage Uncertainty • Accuracy ≠ Precision
Measurement Uncertainty • Different conventions are used to report measurement uncertainty. • What does ±5 mean in m = 75 ±5? • Estimated Standard Deviation: • Estimated Standard Error: m = /√N • Expanded Uncertainty of ± 2 or 3 Sometimes ± 1 (Why?) • 95% or 99% Confidence Interval • Standard Uncertainty: u • Combined Standard Uncertainty: uc
Measurement Uncertainty • Typical Reports • Physici
Measurement as a Process Basic Concepts • Components of the Measurement System • Requirements of a Measurement System • Factors Affecting a Measurement System • Characteristics of a Measurement System Features (Qualities) of a Measurement Number • Units (Scale) • Accuracy • Precision (Consistency or Repeatability) • Resolution (Reproducibility)
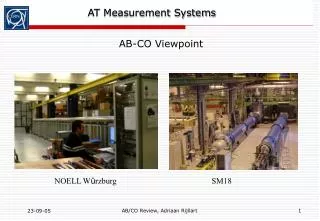
Measurement Related Systems Typical Experiences with Measurement Systems
Basic Concepts • Every Process Produces a “Product” • Every Product Possesses Qualities (Features) • Every Quality Feature Can Be Measured • Total Variation = ProductVariation+MeasurementVariation • Some Variation Inherent in System Design • Some Variation is Due to a Faulty Performance of the System(s)
The Measurement Process What is the ‘Product’ of the Measurement Process? What are the Features or Qualities of this Product? How Can We Measure Those Features?
Measurement Systems Components • Material to be Inspected Piece Continuous • Characteristic to be Measured • Collecting and Preparing Specimens • Type and Scale of Measurement • Instrument or Test Set • Inspector or Technician AIAG calls these ‘Appraiser’ • Conditions of Use
Where Does It Start? During the Design (APQP) Stage: The engineer responsible for determining inspections and tests, and for specifying appropriate equipment should be well versed in measurement systems. The Calibration folks should be part of the process as a part of a cross-functional team. Variability chosen instrument must be small when compared with: Process Variability Specification Limits
Typical Progression Determine ‘Critical’ Characteristic Product Engineer How will the data be used? Determine Required Resolution Product Engineer Consideration of the Entire Measurement System for the Characteristic (Variables) Cross-Functional Determine What Equipment is Already Available Metrology
Material Inspector Methods Test Method Sample Collection Training Workmanship Sample Preparation Parallax Practice Samples Reproducibility Ergonomics Standards Measurement Discrimination Vibration Bias Temperature Repeatability Lighting Calibration Linearity Humidity Instrument Environment Measurement Systems Variables Fixture Eyesight Air Pressure Air Movement Fatigue These are some of the variables in a measurement system. What others can you think of?
Determining What To Measure External Requirements • Voice of the Customer You Must Convert to Technical Features • Technical Features • Failure Modes Analysis • Control Plan Convert To Internal Requirements
Voice of the Customer Customer may specify causes rather than output • External and InternalCustomers • Stated vs Real and PerceivedNeeds • CulturalNeeds • Unintended Uses • Functional Needs vs. Technical Features
Convert to Technical Features • Agreed upon Measure(s) • Related to Functional Needs • Understandable • Uniform Interpretation • Broad Application • Economical • Compatible • Basis for Decisions Y Functional Need Z Technical Feature
Failure Modes Analysis • Design FMEA • Process FMEA • Identify Key Features • Identify Control Needs Critical Features are Defined Here!
Automotive FMEA Leading to MSA. Critical features are determined by the FMEA (RPN indicators) and put into the Control Plan.
Control Plan / Flow Diagram • Inspection Points • Inspection Frequency • Instrument • Measurement Scale • Sample Preparation • Inspection/Test Method • Inspector (who?) • Method of Analysis
Standard Control Plan Example This form is on course disk
Measurement as a System • Choosing the Right Instrument Instrument Calibration Needs Standards or Masters Needed Accuracy and Precision • Measurement Practices Where How Many Places • Reported Figures Significant Figures Rule 2 Action Figures Rule of 10 Individuals, Averages, High-Lows
Measurement Error Measured Value (y) = True Value (x) + Measurement Error Deming says there is no such thing as a ‘True’ Value. Consistent (linear)?
Sources of Measurement Error • Sensitivity (Threshold) Chemical Indicators • Discrimination • Precision (Repeatability) • Accuracy (Bias) • Damage • Differences in use by Inspector (Reproducibility) Training Issues • Differences Among Instruments and Fixtures • Differences Among Methods of Use • Differences Due to Environment
Types of Measurement Scales • Variables Can be measured on a continuous scale Defined, standard Units of Measurement • Attributes No scale Derived ‘Unit of Measurement’ Can be observed or counted Either present or not Needs large sample size because of low information content
How We Get Data • Inspection • Measurement • Test Includes Sensory (e.g..: Beer) Magnitude of Quality
Operational Definitions • Is the containerRound? • Is your softwareAccurate? • Is the computer screenClean? • Is the truckOn Time?
Different Method = Different Results Method 1 Method 2 Out of Spec In Spec
Measurement System Variability • Small with respect to Process Variation • Small with respect to Specified Requirements • Must be in Statistical Control MeasurementIS a Process! Free of Assignable Causes of variation
Studying the Measurement System • EnvironmentalFactors • HumanFactors • SystemFeatures • Measurement Studies
Standards • National In the US - Kept or Tracked by NIST • Primary Copied directly from National Standard using ‘State-of-the-Art’ Equipment • Secondary Transferred from Primary Standard • Working Used to calibrate laboratory and shop instruments
Environmental Factors • Temperature • Humidity • Vibration • Lighting • Corrosion • Wear • Contaminants Oil & Grease Aerosols Where is the study performed? 1. Lab? 2. Where used? 3. Both?
Human Factors • Training • Skills • Fatigue • Boredom • Eyesight • Comfort • Complexity of Part • Speed of Inspection (parts per hour) • Misunderstood Instructions
Human Measurement Errors Unaware of problem • Sources of Errors Inadvertent Errors • Attentiveness • Random • Good Mistake-Proofing Target Technique Errors • Consistent Wilful Errors (Bad mood) • Error Types (Can be machine or human) Type I - Alpha Errors [ risk] Type II - Beta Errors [ risk] Good Bad OK! beta Accept Training Issue alpha Reject OK! Process in control, but needs adjustment, False alarm
Measurement System Features • Discrimination Ability to tell things apart • Bias [per AIAG] (Accuracy) • Repeatability [per AIAG](Precision) • Reproducibility • Linearity • Stability
Discrimination • Readable Increments of Scale • If Unit of Measure is too course: Process variation will be lost in Rounding Off • The “Rule of Ten”: Ten possible values between limits is ideal Five Possible Values: Marginally useful Four or Less: Inadequate Discrimination
Range Charts & Discrimination Indicates Poor Precision
Bias and Repeatability Precise Imprecise Accurate Bias Inaccurate You can correct for Bias You can NOTcorrect for Imprecision
Bias • Difference between average of measurements and an Agreed Upon standard value • Known as Accuracy • Cannot be evaluated without a Standard • Adds a Consistent “Bias Factor” to ALL measurements • Affects all measurements in the same way Bias Standard Value Measurement Scale
Causes of Bias • Error in Master • Worn components • Instrument improperly calibrated • Instrument damaged • Instrument improperly used • Instrument read incorrectly • Part set incorrectly (wrong datum)
Bias and QS9000 Bias - The difference between the observed Average of measurements and the master Average of the same parts using precision instruments.(MSA Manual Glossary) The auditor may want evidence that the concept of bias is understood. Remember that bias is basically an offset from ‘zero’. Bias is linked to Stability in the sense that an instrument may be ‘zeroed’ during calibration verification. Knowing this we deduce that the bias changes with instrument use. This is in part the concept of Drift.